

Abstract
We have demonstrated previously that the administration of CTLA-4 blockade has mediated objective cancer regression and autoimmunity in patients with metastatic melanoma. To explore the mechanism of these in vivo effects, we have studied the changes in lymphocyte phenotype and function in patients receiving anti-CTLA-4 Ab (MDX-010). Patients with stage IV melanoma or renal cell cancer were treated every 3 wk with an anti-CTLA-4 Ab with or without peptide immunization. Pheresis samples were analyzed using flow cytometry to determine lymphocyte cell surface markers. Gene expression analyses and proliferation assays were conducted on purified T cell subsets. Anti-CTLA-4 Ab did not inhibit the suppressive activity of CD4+CD25+ cells in vitro or in vivo. In addition, there was no decrease in the expression of CD4+CD25+ cells in whole PBMC, nor a decrease in Foxp3 gene expression in the CD4+ or CD4+CD25+ purified cell populations posttreatment. The percentage of CD4+, CD8+, CD4+CD25+, and CD4+CD25− T cells in PBMC expressing the activation marker HLA-DR increased following anti-CTLA-4 Ab administration. Therefore, our results suggest that the antitumor effects of CTLA-4 blockade are due to increased T cell activation rather than inhibition or depletion of T regulatory cells.
T cell activation and proliferation is governed by a balance between positive and negative costimulatory signals that ultimately determine T cell effector function (1–4). In addition to binding of the TCR to an MHC-presented peptide, the interaction of CD80 (B7) on the APC with CD28 on the T cell can lead to T cell activation, proliferation, and effector function (1, 3–6). In contrast, B7 engagement of T cell CTLA-4 inhibits T cell activation, reduces IL-2 production, decreases IL-2R expression, and triggers cell cycle arrest (5, 7–9). The importance of this balance is exemplified by CTLA-4 knockout mice that rapidly develop a fatal lymphoproliferative disorder in the absence of this negative regulation (10, 11). Therefore, CD28 and CTLA-4 have opposing effects that serve to fine-tune the immune response.
CTLA-4 blockade using an anti-CTLA-4 Ab has been shown to enhance antitumor responses in multiple murine models (12–18), but it can also induce autoimmune phenomena, including depigmentation, encephalomyelitis, colitis, and diabetes (15, 18–22). Similar phenomena have been seen in human studies. We have reported previously that treatment of patients with metastatic melanoma using a mAb against CTLA-4 can mediate both objective clinical regressions as well as autoimmunity, including colitis, dermatitis, hepatitis, hypophysitis, and uveitis (23, 24). The durability of these clinical responses has stimulated substantial interest in understanding the mechanism of action of CTLA-4 blockade.
CD4+CD25+ T regulatory cells constitutively express surface CTLA-4 (25, 26), and it has been suggested that this molecule is integral to their regulatory function (22, 25, 26). Therefore, this cell population may be most susceptible to the effects of CTLA-4 blockade. In both mice and humans, CD4+CD25+ T regulatory cells can inhibit the activation of other T cells and suppress proliferation and cytokine secretion of CD4+CD25− cells (27). Selective elimination of CD4+CD25+ cells in mice can result in severe autoimmune disease, while readministration of these cells could prevent autoimmunity (28–30). Moreover, depletion of CD25+ cells delayed growth of the B16 melanoma in C57BL/6 mice (18), and the adoptive transfer of CD25+-depleted CD4+ cells with tumor self-reactive CD8+ T cells and a vaccine induced regression of established melanoma in mice (31), implying that inhibition of T regulatory functions may release autoreactive T cells, including tumor reactive T cells, from peripheral suppressive mechanisms.
Thus, the constitutive expression of CTLA-4 on CD4+CD25+ T regulatory cells has raised the possibility that the clinical impact of CTLA-4 blockade was manifested by depletion or blockade of T regulatory cells. Alternatively, CTLA-4 blockade could act directly on CD4+ and/or CD8+ cells to release inhibitory influences and enhance effector functions. These hypotheses have been explored in humans in the current study by measuring cellular changes following the administration of anti-CTLA-4 Ab to patients with metastatic disease.
Materials and Methods
Clinical protocol
All patients were treated on Investigational Review Board-approved protocols in the Surgery Branch, National Institutes of Health in Bethesda, Maryland. Patients A, E, and G had metastatic renal cell cancer. All other patients had metastatic melanoma. Patients eligible for treatment with anti-CTLA-4 Ab had an Eastern Cooperative Oncology Group performance status ≤2, stage IV disease, no evidence of autoimmune or immunodeficiency disease, and ≥3 wk had elapsed since any previous systemic cancer therapy. The human IgG1κ anti-CTLA-4 mAb, MDX-010 (Medarex), was administered as an i.v. bolus over 90 min every 3 wk. Before Ab administration and 3 wk after each dose course, PBMC were obtained by apheresis, isolated by Ficoll-Hypaque separation, and cryopreserved at −180°C in heat-inactivated human AB serum with 10% DMSO. For suppression assays, fresh lymphocytes were used without any prior cryopreservation.
Response evaluation criteria in solid tumors (RECIST) criteria were used to determine radiographic response to treatment (32). The sum of the longest diameters of all tumors before and after therapy was calculated. A partial response was defined as a decrease of ≥30% (but not 100%) of the sum of the longest diameters of index lesions, lasting at least 1 mo, with no growth of lesions or the appearance of new lesions. A complete response was defined as the disappearance of all lesions for ≥1 mo. Patients not achieving either a partial or complete response were nonresponders. Treatment, autoimmunity, and response characteristics for patients treated with anti-CTLA-4 Ab are summarized in Table I. Patients F and G provided cells for study but were not enrolled in anti-CTLA-4 treatment protocols.
Table I.
Patient treatments, autoimmunity, and responsesa
| Anti-CTLA-4 Ab Treatment
|
|||
|---|---|---|---|
| Patient | Dose level (mg/kg) (no. of doses) | Grade III/IV Autoimmunity | Response |
| A | 3.0 (12) | NR | |
| B | 3.0 (2), 5.0 (2) | NR | |
| C | 5.0 (6) | PR | |
| D | 3.0 (2), 5.0 (2), 9.0 (6) | PR | |
| E | 3.0 (1), 1.0 (3) | NR | |
| 1 | 3.0 (2), 5.0 (2), 9.0 (2) | PR | |
| 2 | 3.0 (2), 5.0 (2), 9.0 (2) | Hypophysitis | PR |
| 3 | 3.0 (2), 5.0 (2), 9.0 (2) | Hypophysitis | NR |
| 4 | 3.0 (2), 5.0 (2), 9.0 (2) | PR | |
| 5 | 3.0 (2) | Colitis, dermatitis | PR |
| 6 | 3.0 (4) | Hypophysitis | CR |
| 7 | 3.0 (1), 1.0 (3) | Colitis | PR |
| 8 | 3.0 (1), 1.0 (1) | NR | |
| 9 | 3.0 (1), 1.0 (1) | NR | |
| 10 | 3.0 (1), 1.0 (1) | NR |
Patients A and E presented with metastatic renal cell cancer. All other patients treated had metastatic melanoma. Patients received the fully human anti-CTLA-4 Ab as an i.v. bolus over 90 min every 3 wk. Pheresis samples were obtained 3 wk after each dose course. CR, complete response; NR, no response; and PR, partial response.
Lymphocyte preparation
CD4+ cells were isolated from whole PBMC by negative selection according to manufacturer’s instructions (CD4-negative isolation kit; Dynal Biotech). For suppression assays, CD4+ cells were further purified into CD25+ and CD25− subpopulations with the Dynal T regulatory kit, and accessory cells were T cell depleted from autologous PBMC using the Dynal CD3+ depletion kit (Dynal Biotech) according to the manufacturer’s instructions. For RT-PCR gene analysis of CD4+ subpopulations, CD4+-purified cells were sorted using a FACSVantage (BD Biosciences) into CD4+CD25+“high” and CD4+CD25−“low” cells, defined as the upper and lower 10% of cells staining for CD25 (CD25-PE; BD Biosciences).
Flow cytometry
Flow cytometry was used to evaluate surface expression of selected T cell markers. Whole PBMC were washed in ice-cold PBS with 0.5% BSA and incubated with appropriate fluorochrome-labeled Abs and relevant isotype controls (CD4-FITC (clone SK3), CD8-FITC (clone SK1), CD25-PE (clone 2A3), CD69-APC (clone L78), and HLA-DR-APC (clone L243); BD Biosciences). Sample fluorescence was acquired and analyzed with a FACSCalibur and CellQuest software (BD Biosciences).
RNA isolation, cDNA synthesis, and real-time PCR
RNA isolation and cDNA synthesis were performed in batches containing pre- and posttreatment samples to minimize variability. Total RNA was isolated using an RNAeasy minikit (Qiagen) and was reverse transcribed to cDNA using the ThermoScript RT-PCR system (Invitrogen Life Technologies) according to the manufacturers’ instructions.
Levels of β-actin and Foxp3 gene expression were assessed with the ABI Prism 7700 Sequence Detection System (PerkinElmer). For β-actin, the forward primer, 5′-GGCACCCAGCACAATGAAG-3′, reverse primer, 5′-GCCGATCCACACGGAGTACT-3′, and probe, 5′-6-FAM TCAAGATCATTGCTCCTCCTGAGCGC-TAMRA-3′, were used. For Foxp3, the combined primer probe reagent (Assay-on-Demand gene expression assay; Applied Biosystems) was used. cDNA was analyzed in a 25-μl mixture containing TaqMan 2× Universal MasterMix (Applied Biosystems) and respective primers and probes at optimized concentrations. All samples were run in duplicate. Foxp3 copy numbers were calculated from a linear regression of known standards that were included in each RT-PCR run. All samples were run with the same set of standards, except samples from patients 5–10, where a different set of internal standards were used. Thermal cycler parameters were 2 min at 50°C, 10 min at 95°C, and 40 cycles of denaturation at 95°C for 15 s with annealing/extension at 60°C.
Suppression assay
The proliferative potential of CD4+CD25+ subpopulations were assessed in coculture assays. CD4+CD25+, CD4+CD25− (1.0 × 10⁴), or both cell subpopulations (1:1; 1.0 × 10⁴ each per well) were cultured with T cell-depleted irradiated accessory cells (5 × 10⁴/well). For polyclonal activation, cells were cultured with 1.0 μg/ml soluble anti-CD3. One microcurie of [3H]thymidine per well was added during the final 18 h of a 5- or 6-day culture, and proliferation was measured using a scintillation counter. These culture conditions and reagent concentrations were optimized for sensitivity in prior experiments. Cultures were performed in 96-well round-bottom plates in sextuplets. Suppression of CD4+CD25− proliferation by CD4+CD25+ cells was calculated using the formula: percentage of suppression = (1 − (1:1 − CD25+/CD25−)) × 100%.
Results
Effects of in vitro CTLA-4 blockade on the function of T regulatory cells
To test whether CTLA-4 blockade could abrogate the suppressive activity of CD4+CD25+ regulatory cells in vitro, coculture assays were performed using pretreatment cells in the presence and in the absence of anti-CTLA-4 Ab. Zero, 10, or 100 μg/ml anti-CTLA-4 Ab was added on day 0 to cultures for all patients, except patient G where Ab was added on days 0, 2, and 4. A typical example of the coculture suppression assay (patient F) is shown in Table II, and a summary of the suppression results on all five patients is shown in Fig. 1. The suppression of CD4+CD25− proliferation by coculture with CD4+CD25+ cells was not significantly affected by the addition of anti-CTLA-4 Ab in vitro.
Table II.
In vitro effect of CTLA-4 blockade on the suppressive function of CD4+CD25+ cellsa
| No anti-CTLA-4
|
100 μg/ml anti-CTLA-4
|
|
|---|---|---|
| Counts per minute ± SEM | ||
| Accessory cells | 103 ± 17 | 101 ± 12 |
| CD25− | 5936 ± 1130 | 3708 ± 1592 |
| CD25+ | 330 ± 25 | 356 ± 77 |
| 1:1 | 2608 ± 686 | 1890 ± 489 |
| % suppression | 62% | 59% |
The effect of CTLA-4 blockade on CD4+CD25+ cell inhibition of CD4+CD25− cell proliferation was measured in a suppression assay. Cell populations were cocultured in a 1:1 ratio for 5 days and pulsed with [3H]thymidine 18 h prior to harvest in representative patient F.
FIGURE 1.
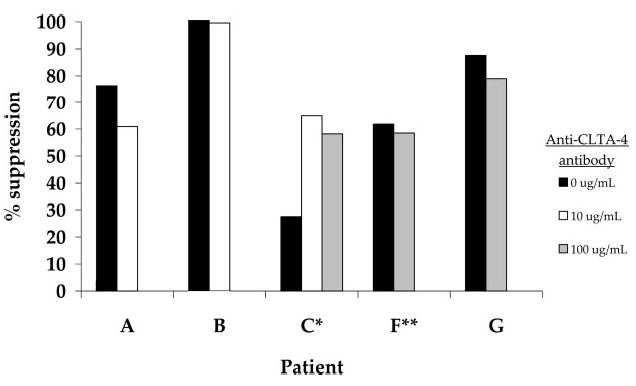
The effect of in vitro CTLA-4 blockade on the suppressive ability of CD4+CD25+ cells. Fresh lymphocytes from five patients were separated into CD4+CD25+ and CD4+CD25− cell populations and treated in vitro with 0, 10, or 100 μg/ml anti-CTLA-4 Ab in a coculture suppression assay. The percent suppression of CD25− proliferation by CD25+ cells was determined in the presence and in the absence of anti-CTLA-4 Ab. PBMC were obtained from patients A, B, and C after treatment in vivo with two or more doses of anti-CTLA-4 Ab and from patients F and G who were not treated with Ab in vivo. *, Anti-CTLA-4 Ab was added on days 0, 2, and 4 of culture. For all other cultures Ab was added on day 0. **, Cells were pulsed with [3H]thymidine on day 4 of culture and harvested on day 5. All other cultures were pulsed on day 5 and harvested on day 6.
Effects of in vivo CTLA-4 blockade on the expression of T regulatory cells
Pheresis samples from four patients treated in vivo with escalating doses of anti-CTLA-4 Ab every 3 wk were evaluated using flow cytometry for phenotype expression before treatment and after receiving two doses each at 3, 5, and 9 mg/kg. The percentage of PBMC expressing CD4+CD25+ was analyzed in the total CD4+ population by gating on the isotype control (Fig. 2, lower panel). In addition, the CD4+CD25+“high” population, thought to contain a higher proportion of regulatory cells (27, 33), was analyzed by gating the upper 10% of CD4+CD25+ cells in the pretreatment sample and using that gate to evaluate subsequent posttreatment samples (Fig. 2, upper panel). The administration of anti-CTLA-4 Ab in vivo did not appear to cause a consistent change in the percentage of CD4+ lymphocytes expressing CD4+CD25+ posttreatment compared with pretreatment when analyzed in both the total CD4+ and the “high” CD25+ subpopulations (Fig. 2).
FIGURE 2.
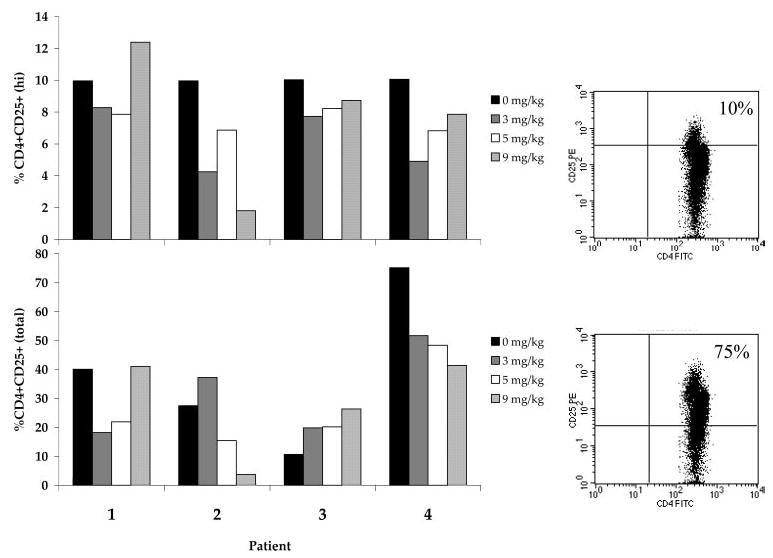
Expression of CD4+ CD25+ cells in PBMC of patients treated in vivo with anti-CTLA-4 Ab. Patients were treated in vivo with escalating doses of anti-CTLA-4 Ab every 3 wk. PBMC were evaluated pretreatment and after two doses of Ab at each dose level of 3, 5, and 9 mg/kg. The percentage of CD25+ cells was determined by gating on the isotype control (lower panel), or based on the upper 10% of CD4+CD25+-expressing cells on the pretreatment sample (upper panel). Examples of pretreatment sample FACS gating of these two populations from patient 4 are shown in the corresponding panels to the right of the histogram. There were no consistent changes in the percentage of CD25+ cells in the CD4+ cell population resulting from the administration of anti-CTLA-4 Ab.
Effects of in vivo CTLA-4 blockade on Foxp3 gene expression
Foxp3 is highly expressed in CD4+CD25+ T regulatory cells and has been described as a lineage specification factor for these cells (34). Thus, CD4+ cells were purified from the PBMC of the four patients from whom data were obtained for Fig. 2, and Foxp3 gene expression was determined relative to the expression of β-actin. There was no consistent difference in Foxp3 expression in CD4+ cells as a function of Ab dose in patients treated with 3, 5, or 9 mg/kg anti-CTLA-4 Ab, although there was a trend toward higher relative Foxp3 levels at some anti-CTLA-4 doses compared with pretreatment levels in each patient (relative Foxp3 levels at 3, 5, and 9 mg/kg: +2.96, p = 0.24; +3.26, p = 0.18; +4.61, p = 0.05; not corrected for multiple analyses). (Fig. 3).
FIGURE 3.
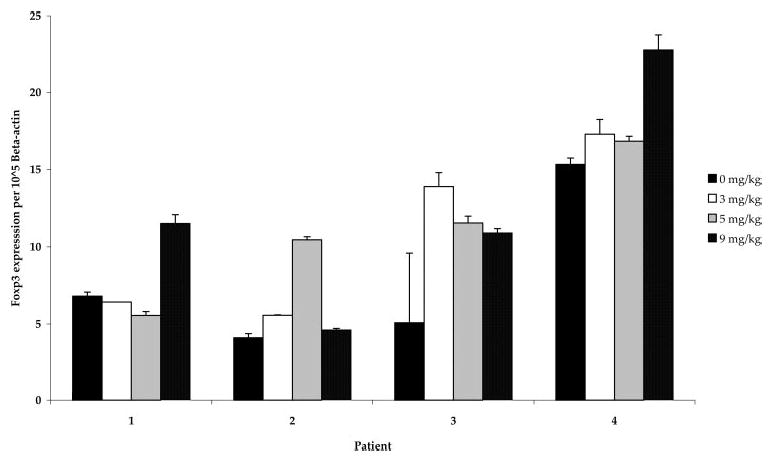
Relative Foxp3 levels in CD4+ cells from patients treated with CTLA-4 blockade. CD4+ lymphocytes were separated from PBMC obtained from patients pre- and posttreatment with anti-CTLA-4 Ab at 3, 5, and 9 mg/kg. Foxp3 gene expression relative to β-actin did not change consistently across doses, although there was a trend toward higher relative levels at some Ab doses compared with pretreatment levels (relative Foxp3 levels at 3, 5, and 9 mg/kg: +2.96, p = 0.24; +3.26, p = 0.18; +4.61, p = 0.05; paired t tests, not corrected for multiple analyses).
CD4+ lymphocyte populations from an additional six patients treated at 3 mg/kg anti-CTLA-4 Ab were studied before and after treatment to determine relative Foxp3 gene expression in purified CD4+ cells. Table III shows Foxp3 levels relative to β-actin in PBMC from all 10 patients before and after receiving anti-CTLA-4 Ab. Eight of these 10 patients revealed an increase in relative Foxp3 gene expression posttreatment, again suggesting that this Ab may have an agonistic effect in vivo on Foxp3-expressing cells.
Table III.
Foxp3 gene expression relative to β-actin in CD4+ cells from patients treated at 3 mg/kg anti-CTLA-4 Aba
| Patient | Pretreatment | After 3 mg/kg |
|---|---|---|
| 1 | 6.80 ± 0.26 | 6.40 ± 0.01 |
| 2 | 4.10 ± 0.27 | 5.56 ± 0.02 |
| 3 | 5.08 ± 4.51 | 13.90 ± 0.90 |
| 4 | 15.33 ± 0.41 | 17.29 ± 0.96 |
| 5 | 0.16 ± 0.01 | 0.32 ± 0.01 |
| 6 | 0.10 ± 0.00 | 0.22 ± 0.01 |
| 7 | 0.17 ± 0.01 | 0.23 ± 0.01 |
| 8 | 0.08 ± 0.01 | 0.17 ± 0.00 |
| 9 | 0.17 ± 0.01 | 0.27 ± 0.00 |
| 10 | 0.26 ± 0.02 | 0.25 ± 0.00 |
CD4+ lymphocytes were purified from patients 1–10 before and after treatment with anti-CTLA-4 Ab. Patients 1–4 were treated with Ab alone, and patients 5–10 were treated with Ab plus peptide vaccine in two separate experiments. Foxp3 gene expression relative to β-actin was determined pretreatment and after receiving at least one dose at 3.0 mg/kg anti-CTLA-4 Ab.
CD4+ lymphocytes obtained before and after in vivo anti-CTLA-4 treatment from patients 5–10 were further sorted using flow cytometry to purify the upper 10% of cells expressing CD4+CD25+ (“high”) and the lower 10% of cells expressing CD4+CD25− (“low”) (Fig. 4, right panel). Patient 7 was not evaluated because of insufficient cell yield postseparation. Foxp3 gene expression relative to β-actin in these highly purified CD25+ and CD25− subpopulations was determined. As expected, very low levels of Foxp3 gene expression were seen in CD25− low populations compared with the CD25+ high populations. There was a significant increase in relative Foxp3 expression in PBMC obtained posttreatment compared with pretreatment in the CD4+CD25+ high population ( p = 0.05, paired t test) (Fig. 4).
FIGURE 4.
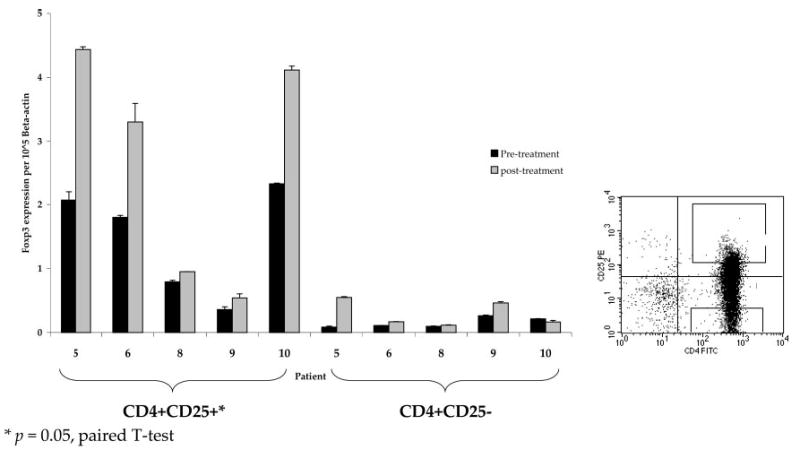
Relative Foxp3 levels in CD4+CD25+ and CD4+CD25− cells from patients treated with CTLA-4 blockade. Lymphocytes from patients treated with at least one dose of anti-CTLA-4 Ab at 3 mg/kg were highly purified by flow cytometry into CD4+CD25+ high and CD4+CD25− low populations. Cell acquisition was accomplished by flow sorting the upper 10% of CD4+CD25+ cells and the lower 10% of CD4+CD25− cells (right panel). Foxp3 gene expression relative to β-actin was higher in CD25+ compared with CD25− cells and significantly increased in CD4+CD25+ cell subpopulations posttreatment with anti-CTLA-4 Ab compared with pretreatment (p = 0.05, paired t test).
Results using direct staining for Foxp3 or GITR are inconsistent in the literature, and we were not able to obtain reproducible results with commercially available Abs.
Effects of in vivo CTLA-4 blockade on the function of T regulatory cells
To test whether CD4+CD25+ cells from patients treated with CTLA-4 blockade maintained suppressive function posttreatment, lymphocytes from patients treated with anti-CTLA-4 Ab in vivo were evaluated in coculture suppression assays. Lymphocytes from five patients for whom fresh pheresis samples were available were bead purified into CD4+CD25+ and CD4+CD25− cell populations. All patients had received multiple doses of anti-CTLA-4 Ab and were apheresed after the last dose (Table I). These posttreatment CD4+CD25+ cells displayed a persistent ability to suppress proliferation of CD4+CD25− cells, ranging from 49 to 84%, thus indicating that CTLA-4 blockade in vivo did not eliminate circulating lymphocytes with suppressive function (Fig. 5).
FIGURE 5.
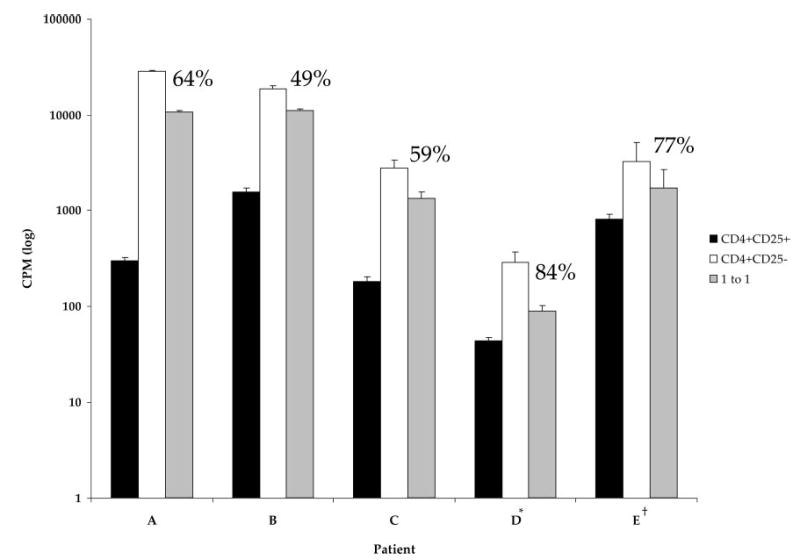
Suppression of CD25− cell proliferation by CD25+ cells in patients after in vivo CTLA-4 blockade. Fresh pheresis samples from five patients were bead purified into CD4+CD25+ and CD4+CD25− subpopulations for use in suppression assays. Samples were taken from patients after receiving at least four doses of anti-CTLA-4 Ab. CD4+CD25+ cells displayed a persistent ability to suppress proliferation of CD4+CD25− cells after in vivo treatment with CTLA-4 blockade. *, Cultures were pulsed with [3H]thymidine on day 5 and harvested on day 6. All other cultures were pulsed on day 4 and harvested on day 5. †, A total of 5000 cells/population was cultured. All other cultures were plated with 10,000 cells/population.
Effects of in vivo CTLA-4 blockade on the activation of T cells
To evaluate the influence of CTLA-4 blockade on the activation state of lymphocytes, whole PBMC from four patients who received the highest doses of anti-CTLA-4 were evaluated using flow cytometry to evaluate cell surface markers characteristic of lymphocyte activation. An example of HLA-DR expression on CD4+ cells is shown in Fig. 6. A trend toward an increase in HLA-DR expression was seen on CD4+ lymphocytes in patients tested after receiving 3 mg/kg (+8.55, p = 0.07, paired t test), 5 mg/kg (+12.78, p = 0.08, paired t test), and 9 mg/kg (+13.12, p = 0.11, paired t test) anti-CTLA-4 Ab. A trend toward increase in HLA-DR expression was also seen on CD8+ lymphocytes in patients tested after receiving 3 mg/kg (+9.69, p = 0.12, paired t test), 5 mg/kg (+14.35, p = 0.02, paired t test), and 9 mg/kg (+15.46, p = 0.03, paired t test) anti-CTLA-4 Ab, with the exception of patient 1, in whom CD8+HLA-DR+ levels remained stable at 3 mg/kg before increasing (Fig. 7).
FIGURE 6.
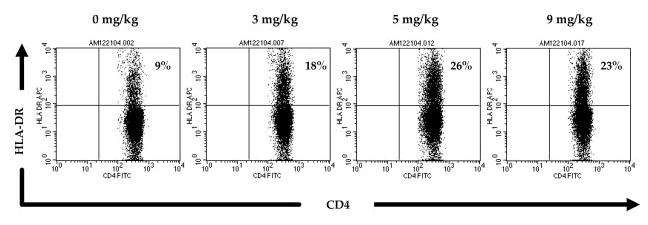
HLA-DR expression on CD4+ lymphocytes in a patient treated with escalating doses of anti-CTLA-4 Ab. Whole PBMC from patient 4 were analyzed by FACS for expression of the lymphocyte activation marker HLA-DR on CD4+ cells. This patient was treated with escalating doses of anti-CTLA-4 Ab (3, 5, and 9 mg/kg) and tested before and after each dose level as indicated. Expression of HLA-DR on CD4+ cells increased over pretreatment with administration of Ab at all doses.
FIGURE 7.
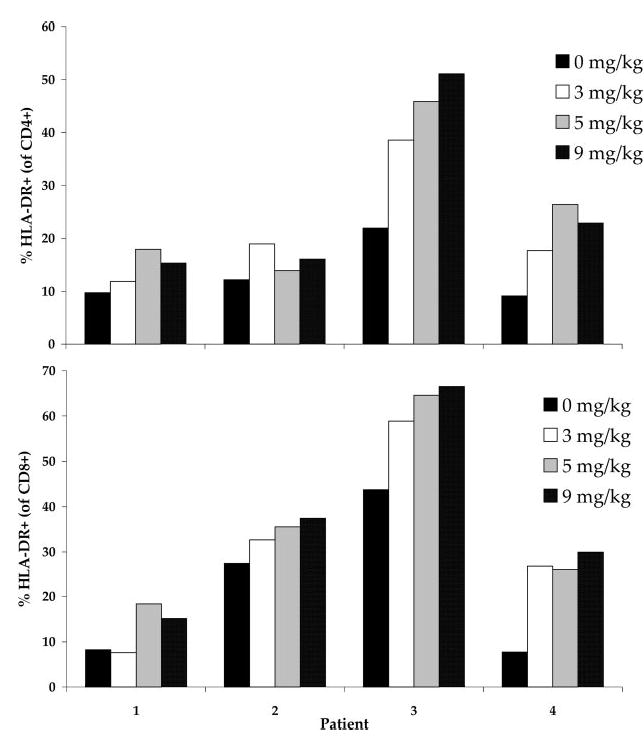
HLA-DR expression on CD4+ and CD8+ lymphocytes in patients treated with escalating doses of anti-CTLA-4 Ab. PBMC from patients treated with escalating doses of anti-CTLA-4 Ab (3, 5, and 9 mg/kg) were analyzed by FACS for expression of the activation marker HLA-DR on CD4+ and CD8+ cells before and after treatment at each Ab dose level. HLA-DR expression on both CD4+ and CD8+ lymphocytes increased with escalating Ab doses. The change was statistically significant in the CD8+ population after receiving treatment at both 5 and 9 mg/kg anti-CTLA-4 Ab (p = 0.02 and p = 0.03, paired t test; not corrected for multiple analyses).
Analysis of HLA-DR expression on the CD4+CD25+ and CD4+CD25− subpopulations in the same patients was also performed. Although there was no clear dose-response effect in the patients tested, there was a trend toward increased HLA-DR expression on both CD4+CD25+ and CD4+CD25− subpopulations (Fig. 8). There was no significant change in CD69 expression on CD4+ or CD8+ lymphocytes after treatment with CTLA-4 blockade (data not shown).
FIGURE 8.
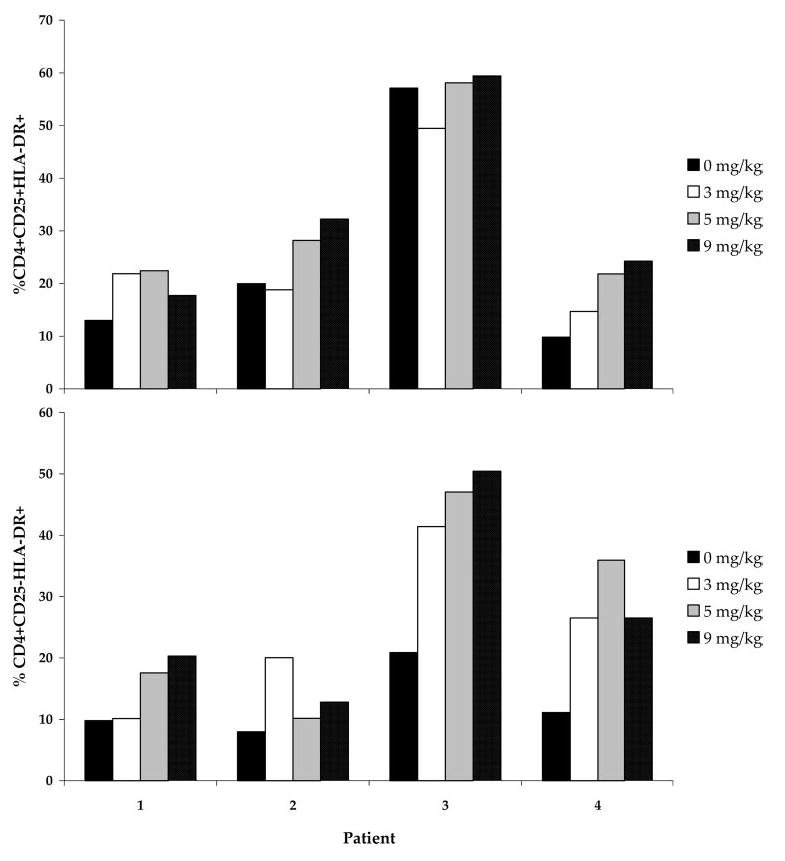
HLA-DR expression on CD4+CD25+ and CD4+CD25− lymphocytes in patients treated with escalating doses of anti-CTLA-4 Ab. PBMC from patients treated with escalating doses of anti-CTLA-4 Ab (3, 5, and 9 mg/kg) were analyzed by FACS for expression of the activation marker HLA-DR on CD4+CD25+ and CD4+CD25− cells before treatment and after administration at each dose level. There was a trend toward increased HLA-DR expression on both subpopulations after treatment, with a significant increase observed after Ab administration at 5 mg/kg vs pretreatment (p = 0.05; not corrected for multiple analyses).
These studies involved a small number of patients. Thus, we reviewed phenotypic markers of activation that were analyzed previously in 30 patients before and after treatment with anti-CTLA-4 Ab in two separate dose cohorts in the Surgery Branch, National Cancer Institute. A small but significant increase in the percentage of HLA-DR expression on CD4+ ( p = 0.0001 and p = 0.0004, paired t test) and CD8+ ( p = 0.015 and p = 0.04, paired t test) lymphocytes was seen in posttreatment samples compared with pretreatment in both studies. There was also a significant increase in CD45RO expression ( p = 0.009 and p = 0.04, paired t test) and a trend toward a decrease in CD25 expression ( p = 0.047 and p = 0.13, paired t test) on CD4+ cells after in vivo treatment with anti-CTLA-4 Ab (23, 24) (Table IV).
Table IV.
Phenotypic markers of lymphocyte activation in patients treated with CTLA-4 blockadea
| % ΔHLA-DR
|
% ΔCD25
|
% ΔCD45RO
|
||||
|---|---|---|---|---|---|---|
| Dose Schedule (mg/kg) | Reference | Patients Analyzed | CD4+ | CD8+ | CD4+ | CD4+ |
| 3 + 3 | 23 | 14 | +16.8* | +10.0* | −5.4 | +5.9* |
| 3 + 1 | 24 | 16 | +9.8* | +2.3* | −4.7* | +10.0* |
| 3 + 3 + 5 + 5 + 9 + 9 | Current study | 4 | +13.1 | +15.5* | −7.2 | ND |
Lymphocytes from patients treated on various CTLA-4 blockade protocols in the Surgery Branch were analyzed by FACS for phenotypic markers of activation in posttreatment samples compared with pretreatment samples. ND, not done.
, p < 0.05, paired t test.
Discussion
The administration of anti-CTLA-4 Ab to patients with metastatic melanoma induced durable objective clinical responses that were highly associated with the induction of autoimmune side effects (23, 24). However, the mechanism responsible for tumor regression and autoimmunity was unclear, although two dominant hypotheses have been proposed. CTLA-4 is constitutively expressed on CD4+CD25+ T regulatory cells (25, 26); hence, the administration of an anti-CTLA-4 Ab may lead to the depletion or inhibition of these regulatory cells, with a resultant increase in the activity of effector T cells. Alternatively, CTLA-4 engagement imparts an inhibitory signal to the T cell (5), and the blockade of CTLA-4 may directly tip the balance toward T cell effector function. These two possibilities have been studied in this report.
We first addressed the impact of anti-CTLA-4 Ab on CD4+CD25+ T cell regulatory cell function in vitro using a coculture suppression assay. This proliferation assay was developed to functionally identify murine and human CD4+CD25+ T regulatory cells by their ability to suppress the proliferation of CD4+CD25− cells (26, 27, 33, 35, 36). Physiologic concentrations of anti-CTLA-4 Ab cocultured with purified populations of CD4+CD25+ lymphocytes did not abolish their ability to suppress the proliferation of CD4+CD25+ human lymphocytes (Table II and Fig. 1).
We next studied the phenotype and function of PBMC obtained from patients who received multiple doses of anti-CTLA-4 Ab in vivo. There was no consistent dose-response effect in the percentage of cells expressing CD4+CD25+ posttreatment compared with pretreatment in either the total CD4+ fraction or the CD25+“high” fraction, which may be more representative of CD4+ cells with regulatory function (27, 33). These studies suggested that the administration of anti-CTLA-4 Ab did not deplete circulating CD4+CD25+ cells. This was further evaluated by assessing the effect of CTLA-4 blockade on a specific genetic marker of regulatory T cells. Foxp3 expression is restricted to CD4+CD25+ regulatory cells in mice, and forced gene expression of Foxp3 by viral transduction can impart regulatory activity to normal T cells (37–39). Furthermore, mutations in the murine foxp3 gene causes a fatal autoimmune disorder, termed scurfy, and a similar disease, immune dysregulation, polyendocrinopathy, X-linked syndrome, occurs in humans carrying a mutation in the human Foxp3 gene, which shares 86% similarity to the murine homologue (40–45). Although the role of Foxp3 in defining T regulatory cells in mice is clearer than in humans (34), its gene expression is a surrogate for identification of human T regulatory cells. In CD4+ cells, relative Foxp3 expression did not consistently change in patients treated with anti-CTLA-4 Ab at multiple dose levels and, in fact, increased at some dose levels. In patients evaluated after administration of 3 mg/kg Ab, there appeared to be an increase in Foxp3 gene expression that was evident in patients that showed a clinical antitumor response and in those that did not, regardless of whether the patient experienced grade III/IV autoimmunity. We then further purified this CD4+ population into CD4+CD25+ and CD4+CD25− populations by flow sorting for the highest and lowest expressors of CD25 and evaluated Foxp3 gene expression in these subpopulations. Relative Foxp3 expression in the CD4+CD25+“high” population significantly increased in posttreatment compared with pretreatment CD4+ cells independent of patient clinical antitumor response or autoimmunity status. Thus, assessment of Foxp3 expression in either the CD4+ or the CD4+CD25+ lymphocyte populations suggested that administration of Ab to CTLA-4 may be agonistic to T regulatory cells, rather than antagonistic. It should be mentioned that all measurements were made on cells taken 3 wk after the dose of anti-CTLA4 Ab.
Functional assays represent the most direct method for assessing the presence of T regulatory cell-suppressive ability. Therefore, we next analyzed lymphocytes from patients treated with in vivo anti-CTLA-4 Ab, for whom fresh pheresis samples were available, using in vitro suppression assays. These studies revealed that circulating CD4+CD25+ cells obtained after in vivo treatment with anti-CTLA-4 Ab maintained the ability to suppress CD4+CD25− cells by 49–84%. This suppression was evident in PBMC obtained from patients whether or not they experienced clinical response to treatment. Therefore, we concluded that in vivo CTLA-4 blockade did not abolish the suppressive function of T regulatory cells. However, it should be emphasized that the T regulatory subset is incompletely defined at this time, and expression of the Foxp3 gene may not be an adequate marker. It remains possible that a subset of tumor-specific T regulatory cells were depleted.
Because CTLA-4 blockade did not inhibit the expression or function of CD4+CD25+ cells, it seemed very unlikely that the antitumor and autoimmune effects seen in patients were due to enhanced activity of effector T cells secondary to the absence of T regulatory-mediated suppression. Therefore, we turned our attention to an examination of the activation status of T cells from patients that responded to Ab treatment and/or experienced autoimmunity. HLA-DR expression, a T cell activation marker (46, 47), appeared to increase in CD4+ and CD8+ cells obtained from patients after treatment with escalating doses of anti-CTLA-4 Ab. HLA-DR expression also trended to increase in both the CD4+CD25+ and CD4+CD25− cell populations, implying a pan-lymphocytic activation. CD25 and CD69 expression did not change significantly in these patients, although the window in which these phenotypic markers of activation would be up-regulated may have been missed at the time points measured (46, 47). This data was consistent with our prior analyses of patients treated with anti-CTLA-4 Ab and tested at similar time points, where we observed an increase in HLA-DR expression on CD4+ and CD8+ cells and increased CD45RO expression on CD4+ cells after Ab administration in both responders and nonresponders with or without autoimmunity (23, 24).
It should be emphasized that the measurements of T regulatory function, Foxp3 expression, and phenotypic analyses reported here were performed on circulating lymphocytes and not specifically on lymphocytes with antitumor activity. The low levels of antitumor T cells in these patients precluded our ability to measure DR expression specifically on these cells. As reported earlier there was no apparent impact of anti-CTLA-4 Ab administration on the ability to generate antitumor precursors following peptide immunization (23).
Thus, the present data suggest that the antitumor and autoimmune effects seen after CTLA-4 blockade using an anti-CTLA-4 Ab are not due to inhibition or depletion of T regulatory cells but rather appear to act through direct activation of CD4+ and CD8+ effector cells.
Footnotes
Disclosures
The authors have no financial conflict of interest.
References
- 1.Egen JG, Kuhns MS, Allison JP. CTLA-4: new insights into its biological function and use in tumor immunotherapy. Nat Immunol. 2002;3:611–618. doi: 10.1038/ni0702-611. [DOI] [PubMed] [Google Scholar]
- 2.Davis SJ, Ikemizu S, Evans EJ, Fugger L, Bakker TR, van der Merwe PA. The nature of molecular recognition by T cells. Nat Immunol. 2003;4:217–224. doi: 10.1038/ni0303-217. [DOI] [PubMed] [Google Scholar]
- 3.Schwartz RH. T cell anergy. Annu Rev Immunol. 2003;21:305–334. doi: 10.1146/annurev.immunol.21.120601.141110. [DOI] [PubMed] [Google Scholar]
- 4.Chambers CA, Kuhns MS, Egen JG, Allison JP. CTLA-4-mediated inhibition in regulation of T cell responses: mechanisms and manipulation in tumor immunotherapy. Annu Rev Immunol. 2001;19:565–594. doi: 10.1146/annurev.immunol.19.1.565. [DOI] [PubMed] [Google Scholar]
- 5.Alegre ML, Frauwirth KA, Thompson CB. T cell regulation by CD28 and CTLA-4. Nat Rev Immunol. 2001;1:220–228. doi: 10.1038/35105024. [DOI] [PubMed] [Google Scholar]
- 6.Lenschow DJ, Walunas TL, Bluestone JA. CD28/B7 system of T cell costimulation. Annu Rev Immunol. 1996;14:233–258. doi: 10.1146/annurev.immunol.14.1.233. [DOI] [PubMed] [Google Scholar]
- 7.Brunner MC, Chambers CA, Chan FK, Hanke J, Winoto A, Allison JP. CTLA-4-mediated inhibition of early events of T cell proliferation. J Immunol. 1999;162:5813–5820. [PubMed] [Google Scholar]
- 8.Krummel MF, Allison JP. CTLA-4 engagement inhibits IL-2 accumulation and cell cycle progression upon activation of resting T cells. J Exp Med. 1996;183:2533–2540. doi: 10.1084/jem.183.6.2533. [DOI] [PMC free article] [PubMed] [Google Scholar]
- 9.Walunas TL, Bakker CY, Bluestone JA. CTLA-4 ligation blocks CD28-dependent T cell activation. J Exp Med. 1996;183:2541–2550. doi: 10.1084/jem.183.6.2541. [DOI] [PMC free article] [PubMed] [Google Scholar]
- 10.Tivol EA, Borriello F, Schweitzer AN, Lynch WP, Bluestone JA, Sharpe AH. Loss of CTLA-4 leads to massive lymphoproliferation and fatal multiorgan tissue destruction, revealing a critical negative regulatory role of CTLA-4. Immunity. 1995;3:541–547. doi: 10.1016/1074-7613(95)90125-6. [DOI] [PubMed] [Google Scholar]
- 11.Waterhouse P, Penninger JM, Timms E, Wakeham A, Shahinian A, Lee KP, Thompson CB, Griesser H, Mak TW. Lymphoproliferative disorders with early lethality in mice deficient in Ctla-4. Science. 1995;270:985–988. doi: 10.1126/science.270.5238.985. [DOI] [PubMed] [Google Scholar]
- 12.Leach DR, Krummel MF, Allison JP. Enhancement of antitumor immunity by CTLA-4 blockade. Science. 1996;271:1734–1736. doi: 10.1126/science.271.5256.1734. [DOI] [PubMed] [Google Scholar]
- 13.Yang YF, Zou JP, Mu J, Wijesuriya R, Ono S, Walunas T, Bluestone J, Fujiwara H, Hamaoka T. Enhanced induction of antitumor T cell responses by cytotoxic T lymphocyte-associated molecule-4 blockade: the effect is manifested only at the restricted tumor-bearing stages. Cancer Res. 1997;57:4036–4041. [PubMed] [Google Scholar]
- 14.Kwon ED, Hurwitz AA, Foster BA, Madias C, Feldhaus AL, Greenberg NM, Burg MB, Allison JP. Manipulation of T cell costimulatory and inhibitory signals for immunotherapy of prostate cancer. Proc Natl Acad Sci USA. 1997;94:8099–8103. doi: 10.1073/pnas.94.15.8099. [DOI] [PMC free article] [PubMed] [Google Scholar]
- 15.van Elsas A, Hurwitz AA, Allison JP. Combination immunotherapy of B16 melanoma using anti-cytotoxic T lymphocyte-associated antigen 4 (CTLA-4) and granulocyte/macrophage colony-stimulating factor (GM-CSF)-producing vaccines induces rejection of subcutaneous and metastatic tumors accompanied by autoimmune depigmentation. J Exp Med. 1999;190:355–366. doi: 10.1084/jem.190.3.355. [DOI] [PMC free article] [PubMed] [Google Scholar]
- 16.Davila E, Kennedy R, Celis E. Generation of antitumor immunity by cytotoxic T lymphocyte epitope peptide vaccination, CpG-oligodeoxynucleotide adjuvant, and CTLA-4 blockade. Cancer Res. 2003;63:3281–3288. [PubMed] [Google Scholar]
- 17.Espenschied J, Lamont J, Longmate J, Pendas S, Wang Z, Diamond DJ, Ellenhorn JD. CTLA-4 blockade enhances the therapeutic effect of an attenuated poxvirus vaccine targeting p53 in an established murine tumor model. J Immunol. 2003;170:3401–3407. doi: 10.4049/jimmunol.170.6.3401. [DOI] [PubMed] [Google Scholar]
- 18.Sutmuller RP, van Duivenvoorde LM, van Elsas A, Schumacher TN, Wildenberg ME, Allison JP, Toes RE, Offringa R, Melief CJ. Synergism of cytotoxic T lymphocyte-associated antigen 4 blockade and depletion of CD25+ regulatory T cells in antitumor therapy reveals alternative pathways for suppression of autoreactive cytotoxic T lymphocyte responses. J Exp Med. 2001;194:823–832. doi: 10.1084/jem.194.6.823. [DOI] [PMC free article] [PubMed] [Google Scholar]
- 19.Hurwitz AA, Sullivan TJ, Krummel MF, Sobel RA, Allison JP. Specific blockade of CTLA-4/B7 interactions results in exacerbated clinical and histologic disease in an actively-induced model of experimental allergic encephalomyelitis. J Neuroimmunol. 1997;73:57–62. doi: 10.1016/s0165-5728(96)00168-3. [DOI] [PubMed] [Google Scholar]
- 20.Luhder F, Hoglund P, Allison JP, Benoist C, Mathis D. Cytotoxic T lymphocyte-associated antigen 4 (CTLA-4) regulates the unfolding of autoimmune diabetes. J Exp Med. 1998;187:427–432. doi: 10.1084/jem.187.3.427. [DOI] [PMC free article] [PubMed] [Google Scholar]
- 21.Perrin PJ, Maldonado JH, Davis TA, June CH, Racke MK. CTLA-4 blockade enhances clinical disease and cytokine production during experimental allergic encephalomyelitis. J Immunol. 1996;157:1333–1336. [PubMed] [Google Scholar]
- 22.Read S, Malmstrom V, Powrie F. Cytotoxic T lymphocyte-associated antigen 4 plays an essential role in the function of CD25+CD4+ regulatory cells that control intestinal inflammation. J Exp Med. 2000;192:295–302. doi: 10.1084/jem.192.2.295. [DOI] [PMC free article] [PubMed] [Google Scholar]
- 23.Phan GQ, Yang JC, Sherry RM, Hwu P, Topalian SL, Schwartzentruber DJ, Restifo NP, Haworth LR, Seipp CA, Freezer LJ, et al. Cancer regression and autoimmunity induced by cytotoxic T lymphocyte-associated antigen 4 blockade in patients with metastatic melanoma. Proc Natl Acad Sci USA. 2003;100:8372–8377. doi: 10.1073/pnas.1533209100. [DOI] [PMC free article] [PubMed] [Google Scholar]
- 24.Attia P, Phan GQ, Maker AV, Robinson MR, Quezado MM, Yang JC, Sherry R, Topalian SL, Kammula US, Royal RE, et al. Autoimmunity correlates with tumor regression in patients with metastatic melanoma treated with anti-CTLA-4. J Clin Oncol. 2005;23:6043–6053. doi: 10.1200/JCO.2005.06.205. [DOI] [PMC free article] [PubMed] [Google Scholar]
- 25.Takahashi T, Tagami T, Yamazaki S, Uede T, Shimizu J, Sakaguchi N, Mak TW, Sakaguchi S. Immunologic self-tolerance maintained by CD25+CD4+ regulatory T cells constitutively expressing cytotoxic T lymphocyte-associated antigen 4. J Exp Med. 2000;192:303–310. doi: 10.1084/jem.192.2.303. [DOI] [PMC free article] [PubMed] [Google Scholar]
- 26.Birebent B, Lorho R, Lechartier H, de Guibert S, Alizadeh M, Vu N, Beauplet A, Robillard N, Semana G. Suppressive properties of human CD4+CD25+ regulatory T cells are dependent on CTLA-4 expression. Eur J Immunol. 2004;34:3485–3496. doi: 10.1002/eji.200324632. [DOI] [PubMed] [Google Scholar]
- 27.Baecher-Allan C, Viglietta V, Hafler DA. Human CD4+CD25+ regulatory T cells. Semin Immunol. 2004;16:89–98. doi: 10.1016/j.smim.2003.12.005. [DOI] [PubMed] [Google Scholar]
- 28.Sakaguchi S, Sakaguchi N, Asano M, Itoh M, Toda M. Immunologic self-tolerance maintained by activated T cells expressing IL-2 receptor α-chains (CD25): breakdown of a single mechanism of self-tolerance causes various autoimmune diseases. J Immunol. 1995;155:1151–1164. [PubMed] [Google Scholar]
- 29.Stephens LA, Mason D. CD25 is a marker for CD4+ thymocytes that prevent autoimmune diabetes in rats, but peripheral T cells with this function are found in both CD25+ and CD25− subpopulations. J Immunol. 2000;165:3105–3110. doi: 10.4049/jimmunol.165.6.3105. [DOI] [PubMed] [Google Scholar]
- 30.Suri-Payer E, Amar AZ, Thornton AM, Shevach EM. CD4+CD25+ T cells inhibit both the induction and effector function of autoreactive T cells and represent a unique lineage of immunoregulatory cells. J Immunol. 1998;160:1212–1218. [PubMed] [Google Scholar]
- 31.Antony PA, Piccirillo CA, Akpinarli A, Finkelstein SE, Speiss PJ, Surman DR, Palmer DC, Chan CC, Klebanoff CA, Overwijk WW, et al. CD8+ T cell immunity against a tumor/self-antigen is augmented by CD4+ T helper cells and hindered by naturally occurring T regulatory cells. J Immunol. 2005;174:2591–2601. doi: 10.4049/jimmunol.174.5.2591. [DOI] [PMC free article] [PubMed] [Google Scholar]
- 32.Therasse P, Arbuck SG, Eisenhauer EA, Wanders J, Kaplan RS, Rubinstein L, Verweij J, Van Glabbeke M, van Oosterom AT, Christian MC, Gwyther SG. New guidelines to evaluate the response to treatment in solid tumors: European Organization for Research and Treatment of Cancer, National Cancer Institute of the United States, National Cancer Institute of Canada. J Natl Cancer Inst. 2000;92:205–216. doi: 10.1093/jnci/92.3.205. [DOI] [PubMed] [Google Scholar]
- 33.Baecher-Allan C, Brown JA, Freeman GJ, Hafler DA. CD4+CD25high regulatory cells in human peripheral blood. J Immunol. 2001;167:1245–1253. doi: 10.4049/jimmunol.167.3.1245. [DOI] [PubMed] [Google Scholar]
- 34.Fontenot JD, Rasmussen JP, Williams LM, Dooley JL, Farr AG, Rudensky AY. Regulatory T cell lineage specification by the forkhead transcription factor foxp3. Immunity. 2005;22:329–341. doi: 10.1016/j.immuni.2005.01.016. [DOI] [PubMed] [Google Scholar]
- 35.Thornton AM, Shevach EM. CD4+CD25+ immunoregulatory T cells suppress polyclonal T cell activation in vitro by inhibiting interleukin 2 production. J Exp Med. 1998;188:287–296. doi: 10.1084/jem.188.2.287. [DOI] [PMC free article] [PubMed] [Google Scholar]
- 36.Javia LR, Rosenberg SA. CD4+CD25+ suppressor lymphocytes in the circulation of patients immunized against melanoma antigens. J Immunother. 2003;26:85–93. doi: 10.1097/00002371-200301000-00009. [DOI] [PMC free article] [PubMed] [Google Scholar]
- 37.Fontenot JD, Gavin MA, Rudensky AY. Foxp3 programs the development and function of CD4+CD25+ regulatory T cells. Nat Immunol. 2003;4:330–336. doi: 10.1038/ni904. [DOI] [PubMed] [Google Scholar]
- 38.Hori S, Nomura T, Sakaguchi S. Control of regulatory T cell development by the transcription factor Foxp3. Science. 2003;299:1057–1061. doi: 10.1126/science.1079490. [DOI] [PubMed] [Google Scholar]
- 39.Fontenot JD, Rudensky AY. Molecular aspects of regulatory T cell development. Semin Immunol. 2004;16:73–80. doi: 10.1016/j.smim.2003.12.002. [DOI] [PubMed] [Google Scholar]
- 40.Bennett CL, Brunkow ME, Ramsdell F, O’Briant KC, Zhu Q, Fuleihan RL, Shigeoka AO, Ochs HD, Chance PF. A rare polyadenylation signal mutation of the FOXP3 gene (AAUAAA→AAUGAA) leads to the IPEX syndrome. Immunogenetics. 2001;53:435–439. doi: 10.1007/s002510100358. [DOI] [PubMed] [Google Scholar]
- 41.Bennett CL, Christie J, Ramsdell F, Brunkow ME, Ferguson PJ, Whitesell L, Kelly TE, Saulsbury FT, Chance PF, Ochs HD. The immune dysregulation, polyendocrinopathy, enteropathy, X-linked syndrome (IPEX) is caused by mutations of FOXP3. Nat Genet. 2001;27:20–21. doi: 10.1038/83713. [DOI] [PubMed] [Google Scholar]
- 42.Brunkow ME, Jeffery EW, Hjerrild KA, Paeper B, Clark LB, Yasayko SA, Wilkinson JE, Galas D, Ziegler SF, Ramsdell F. Disruption of a new forkhead/winged-helix protein, scurfin, results in the fatal lymphoproliferative disorder of the scurfy mouse. Nat Genet. 2001;27:68–73. doi: 10.1038/83784. [DOI] [PubMed] [Google Scholar]
- 43.Gambineri E, Torgerson TR, Ochs HD. Immune dysregulation, polyendocrinopathy, enteropathy, and X-linked inheritance (IPEX), a syndrome of systemic autoimmunity caused by mutations of FOXP3, a critical regulator of T cell homeostasis. Curr Opin Rheumatol. 2003;15:430–435. doi: 10.1097/00002281-200307000-00010. [DOI] [PubMed] [Google Scholar]
- 44.Owen CJ, Jennings CE, Imrie H, Lachaux A, Bridges NA, Cheetham TD, Pearce SH. Mutational analysis of the FOXP3 gene and evidence for genetic heterogeneity in the immunodysregulation, polyendocrinopathy, enteropathy syndrome. J Clin Endocrinol Metab. 2003;88:6034–6039. doi: 10.1210/jc.2003-031080. [DOI] [PubMed] [Google Scholar]
- 45.Wildin RS, Ramsdell F, Peake J, Faravelli F, Casanova JL, Buist N, Levy-Lahad E, Mazzella M, Goulet O, Perroni L, et al. X-linked neonatal diabetes mellitus, enteropathy and endocrinopathy syndrome is the human equivalent of mouse scurfy. Nat Genet. 2001;27:18–20. doi: 10.1038/83707. [DOI] [PubMed] [Google Scholar]
- 46.Arva E, Andersson B. Kinetics of cytokine release and expression of lymphocyte cell-surface activation markers after in vitro stimulation of human peripheral blood mononuclear cells with Streptococcus pneumoniae. Scand J Immunol. 1999;49:237–243. doi: 10.1046/j.1365-3083.1999.00470.x. [DOI] [PubMed] [Google Scholar]
- 47.Reddy M, Eirikis E, Davis C, Davis HM, Prabhakar U. Comparative analysis of lymphocyte activation marker expression and cytokine secretion profile in stimulated human peripheral blood mononuclear cell cultures: an in vitro model to monitor cellular immune function. J Immunol Methods. 2004;293:127–142. doi: 10.1016/j.jim.2004.07.006. [DOI] [PubMed] [Google Scholar]