

Abstract
Many of the eukaryotic phylogenomic analyses published to date were based on alignments of hundreds to thousands of genes. Frequently, in such analyses, the most realistic evolutionary models currently available are often used to minimize the impact of systematic error. However, controversy remains over whether or not idiosyncratic gene family dynamics (i.e., gene duplications and losses) and incorrect orthology assignments are always appropriately taken into account. In this paper, we present an innovative strategy for overcoming orthology assignment problems. Rather than identifying and eliminating genes with paralogy problems, we have constructed a data set comprised exclusively of conserved single-copy protein domains that, unlike most of the commonly used phylogenomic data sets, should be less confounded by orthology miss-assignments. To evaluate the power of this approach, we performed maximum likelihood and Bayesian analyses to infer the evolutionary relationships within the opisthokonts (which includes Metazoa, Fungi, and related unicellular lineages). We used this approach to test 1) whether Filasterea and Ichthyosporea form a clade, 2) the interrelationships of early-branching metazoans, and 3) the relationships among early-branching fungi. We also assessed the impact of some methods that are known to minimize systematic error, including reducing the distance between the outgroup and ingroup taxa or using the CAT evolutionary model. Overall, our analyses support the Filozoa hypothesis in which Ichthyosporea are the first holozoan lineage to emerge followed by Filasterea, Choanoflagellata, and Metazoa. Blastocladiomycota appears as a lineage separate from Chytridiomycota, although this result is not strongly supported. These results represent independent tests of previous phylogenetic hypotheses, highlighting the importance of sophisticated approaches for orthology assignment in phylogenomic analyses.
Keywords: Capsaspora, Filasterea, Filozoa, Holozoa, Ichthyosporea, multicellularity
Introduction
A resolved phylogenetic tree that describes the relationships among organisms is the starting point for any research into the origins of fungi and multicellular animals (metazoans) from their unicellular ancestors (King 2004; Ruiz-Trillo et al. 2007; Rokas 2008; Shalchian-Tabrizi et al. 2008). Previous molecular studies have shown that Metazoa and Fungi share a common ancestor to the exclusion of plants, algae, and other eukaryotic lineages (Baldauf and Palmer 1993). The eukaryotic supergroup that comprises Fungi and Metazoa is known as the Opisthokonta (Cavalier-Smith 1987), and its monophyly has been confirmed by several molecular phylogenetic studies (Cavalier-Smith and Chao 1995; Lang et al. 2002; Medina et al. 2003; Ruiz-Trillo et al. 2004, 2006, 2008; Steenkamp et al. 2006); for a recent review, see Paps and Ruiz-Trillo (2010). Putative synapomorphies of Opisthokonta include a ∼12 amino acid long insertion in the elongation factor 1-alpha gene (EF-1α) (Baldauf and Palmer 1993), a single posterior flagellum at least in one life-cycle stage (Patterson 1999; Cavalier-Smith and Chao 2003) and a haloarchaeal-type tyrosyl tRNA (Huang et al. 2005).
Molecular phylogenies have further shown that in unrooted trees of eukaryotes, Amoebozoa (Cavalier-Smith 1998; Adl et al. 2005) forms a clade with Opisthokonta (Minge et al. 2009). If the root falls outside of this clan (a controversial point, see Roger and Simpson 2009), then the Amoebozoa plus Opisthokonta are a monophyletic group that has been named Unikonta (Cavalier-Smith 2002). In our analyses, Amoebozoa are assumed to be the nearest outgroup to the Opisthokonta. The Opisthokonta themselves are divided into two main lineages: the Holomycota (Liu et al. 2009), which was also named Nucletmyceta (Brown et al. 2009), containing Fungi and their unicellular relatives, such as the nucleariids and Fonticula alba; and the Holozoa (Lang et al. 2002; Brown et al. 2009), which includes Metazoa and their unicellular relatives, such as the Choanoflagellata, Filasterea (Shalchian-Tabrizi et al. 2008), and Ichthyosporea (Cavalier-Smith 1998; Mendoza et al. 2002). Several key groupings within the Holozoa and Holomycota remain contentious. Within Holomycota, the position of F. alba and nucleariids as the sister group to Fungi has been shown in multigene trees (Ruiz-Trillo et al. 2006; Steenkamp et al. 2006; Brown et al. 2009; Liu et al. 2009). However, further evidence is required to determine if the Blastocladiomycetes are part of the Chytridiomycota (Aleshin et al. 2007) or instead represent an independent phylum named the Blastocladiomycota (James et al. 2000, 2006; Brown et al. 2009; Liu et al. 2009).
Multigene and phylogenomic analyses corroborate the monophyly of Holozoa (Ruiz-Trillo et al. 2004, 2006, 2008; Steenkamp et al. 2006; Shalchian-Tabrizi et al. 2008; Brown et al. 2009; Liu et al. 2009). However, both the phylogenetic position of unicellular holozoans and the interrelationships among diploblastic metazoan lineages are still disputed. Filasterea (comprising Capsaspora owczarzaki and Ministeria vibrans) is either the sister group of Ichthyosporea (Ruiz-Trillo et al. 2008) or the sister group to a clade comprised of Metazoa and Choanoflagellata, which together form the Filozoa (Shalchian-Tabrizi et al. 2008). The solution to this issue is of major importance, as genomes of these lineages have been, or are being, sequenced (Ruiz-Trillo et al. 2007). Moreover, we still do not have a robust picture of the evolution and phylogeny of the earliest branching metazoan clades. Previous phylogenetic analyses have produced contradictory trees (Bridge et al. 1995; Cavalier-Smith and Chao 2003; Ender and Schierwater 2003; Dellaporta et al. 2006; Ruiz-Trillo et al. 2008; Srivastava et al. 2008; Schierwater et al. 2009; Philippe et al. 2009, 2011; Pick et al. 2010).
Phylogenomic analyses of the opisthokonts and the eukaryotes have mostly employed the supermatrix approach (for reviews, see Philippe et al. 2005; Jeffroy et al. 2006; de Queiroz and Gatesy 2007; Lartillot and Philippe 2008; Jenner and Littlewood 2008). The rationale is that large concatenated data sets eliminate the stochastic error caused by random noise (Philippe et al. 2005). However, different phylogenomic analyses can produce statistically supported incongruent trees (see, e.g., Ruiz-Trillo et al. 2008 vs. Shalchian-Tabrizi et al. 2008). These discrepancies may be due to differences in (or insufficient) taxon sampling or lack of realism in phylogenetic models that leads to systematic error. An alternative explanation is that orthologous genes may be incorrectly assigned and the use of paralogous genes confuses the phylogenetic signal and thus leads to incorrect trees. Two main approaches have been used to minimize paralogy problems. Some authors infer trees for each individual gene to check for possible orthology miss-assignments (Philippe et al. 2004, 2009; Brinkmann et al. 2005; Burki et al. 2007; Ruiz-Trillo et al. 2008; Shalchian-Tabrizi et al. 2008), whereas others have developed novel methods to improve the selection process of orthologous genes (Roure et al. 2007; Dunn et al. 2008; Hejnol et al. 2009). Here, we present a different strategy that may overcome orthology assignment problems: the identification and concatenation of conserved single-copy protein domains.
Proteins comprise distinct modular domains (Doolittle 1995) and often have complex evolutionary histories because of fusion, fission, shuffling, gain, and loss events (Caetano-Anolles G and Caetano-Anolles D 2003). Protein domains, in contrast, are discrete evolutionary units (Yang and Bourne 2009) that have been proposed to be a more stable “unit” of orthology than complete proteins (Gabaldon 2008), whose architecture between taxa may differ widely (Ponting and Russell 2002). As our principal goal is to generate a phylogeny that best represents the evolutionary histories of the taxa under investigation (Yang et al. 2005), single-copy protein domains (i.e., only one copy of the protein domain is found in each genome) may be more suitable and stable markers as their histories are less likely to be confused by recombination, fusion, fission, and duplication and loss (paralogy) dynamics. However, this approach needs complete or almost complete genome or transcriptome sequences from the taxa under examination.
We therefore constructed a phylogenomic data set comprising 93 conserved single-copy domains for the widest taxonomic sampling possible. Published and publicly available genome and expressed sequence tags (EST) data were used, as well as newly generated genome data from organisms sequenced by the UNICORN project (Ruiz-Trillo et al. 2007), such as the apusozoan Thecamonas trahens, the filasterean C. owczarzaki, the ichthyosporean Sphaeroforma arctica, the choanoflagellate Salpingoeca rosetta, and the fungi Allomyces macrogynus and Spizellomyces punctatus. In addition, we included EST data from another ongoing genome survey project of the filasterean M. vibrans (Shalchian-Tabrizi et al. 2008). Since this approach needs complete or almost complete genome sequences, some key taxa with few sequence data have not been included (i.e., Nuclearia simplex and F. alba). This new data set not only minimizes the problem of orthology assignment but also overlaps by less than 10% with the data used in other published phylogenomic investigations (Brinkmann et al. 2005; Burki et al. 2007; Ruiz-Trillo et al. 2008; Shalchian-Tabrizi et al. 2008; Philippe et al. 2009). Thus, it is an independent way to test previous phylogenetic hypotheses (supplementary tables S1 and S2 in supplementary file 1, Supplementary Material online).
To evaluate this novel data set, we performed maximum likelihood (ML) and Bayesian inference (BI) analyses to test previous hypotheses on 1) the relationship between Filasterea and Ichthyosporea, 2) the phylogeny of early-branching metazoans, and 3) the phylogeny of early-branching fungi. We also assessed the impact of methods that are known to minimize phylogenetic systematic error (Delsuc et al. 2005). Several different data sets were considered each including the closest possible outgroup for the specific phylogenetic question under examination to check whether a closer outgroup affected our results (Philippe 1997; Lartillot and Philippe 2008). Finally, we also assessed the impact of recoding amino acids into functional categories (Woese et al. 1991; Rodriguez-Ezpeleta et al. 2007; Ruiz-Trillo et al. 2008), removing fast-evolving sites (Aguinaldo et al. 1997; Ruiz-Trillo et al. 1999), and excluding the taxa with the most missing data (Philippe 1997; Susko et al. 2005; Gatesy et al. 2007; de la Torre-Barcena et al. 2009).
Materials and Methods
EST and Genomic Data Sources
EST sequences from Amoebidium parasiticum, Oscarella carmela, Oscarella lobularis, Blastocladiella emersonii, Acropora millepora, Acropora palmata, Monosiga ovata, and Clytia hemisphaerica were extracted from the National Center for Biotechnology Information (NCBI). Ministeria vibrans ESTs were obtained in-house. Genome data were extracted from NCBI, the Joint Genome Institute (JGI) and the Broad Institute, as well as from the Baylor College of Medicine (BCM) for Acanthamoeba castellanii. Amphimedon queenslandica data were obtained from its genome database (www.metazome.net/amphimedon). Capsaspora owczarzaki and S. punctatus genome assemblies and annotations are available at the Broad Institute web site (http://www.broadinstitute.org/annotation/genome/multicellularity_project/MultiHome.html). In the case of S. arctica, S. rosetta (formerly known as Proterospongia sp.), T. trahens (formerly known as Amastigomonas sp., see Cavalier-Smith and Chao 2010), and A. macrogynus, the trace data were assembled in-house using the WGS assembler (http://sourceforge.net/apps/mediawiki/wgs-assembler/). The resulting contigs were translated using both Genomescan (Yeh et al. 2001) and Augustus (Stanke et al. 2006) to obtain independent databases of predicted protein sequences.
Selection of Single-Copy Protein Domains
For a schematic summary of sections 2 and 3, see figure 1. Taxonomic sampling started with several species for which a complete genome was available, including seven opisthokonts (Mus musculus, Drosophila melanogaster, Nematostella vectensis, Monosiga brevicollis, Batrachochytrium dendrobatidis, Neurospora crassa, Schizosaccharomyces pombe) and four other eukaryotes (Dictyostelium discoideum, Ostreococcus lucimarinus, Leishmania infantum, and Plasmodium yoelii yoelii). These taxa were also chosen in order to cover the largest possible diversity of eukaryotes and hence maximize the likelihood that the domains we selected were also single copy in other species. These 11 taxa were used as a “seed” sample to obtain an accurate data set of protein domains from PFAM (as available in December 2008). The 5302 protein domains that were initially found were filtered using different methods. First, protein domains were indexed by the number of occurrences in the 11 seed taxa. Thus, for every domain, 1 point was given for each occurrence as a single copy in any of the 11 taxa, but no points were given if the protein domain was absent or present in more than one copy (see supplementary table S3 in supplementary file 1, Supplementary Material online). Furthermore, domains that were smaller than 120 amino acids were filtered using the “Domain model length” from the official PFAM database. To ensure that the domains were mostly single-copy within the widest taxonomic distribution, we only took into account domains with nine points or more, so that they were represented as single-copy in at least 9 of the 11 taxa. This resulted in a selection of 213 domains (supplementary table S4 in supplementary file 1, Supplementary Material online).
FIG. 1.
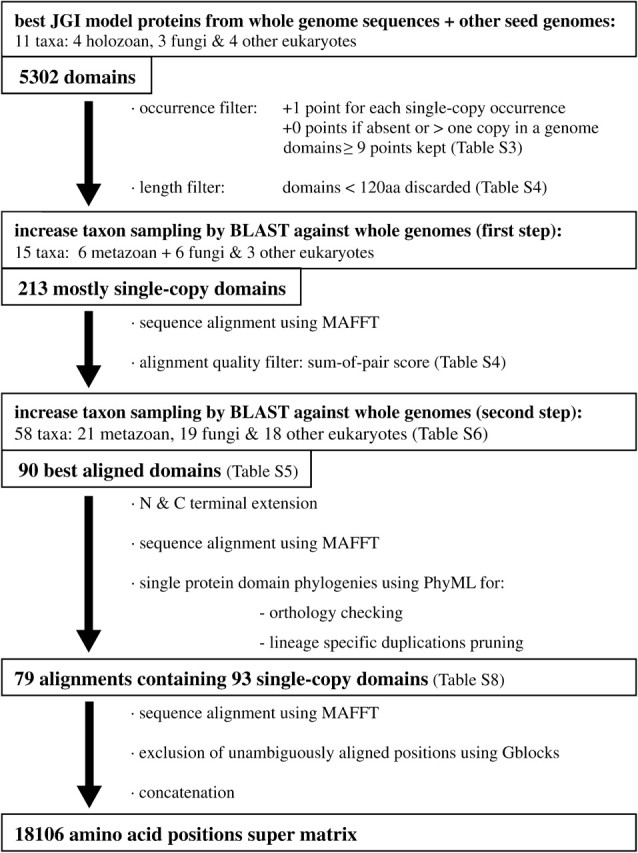
Schematic pipeline of the supermatrix assembly as a summary of sections 2 and 3 of the Materials and Methods.
Once the “single-copy” domains had been chosen, the taxonomic sampling was enriched by representatives from the Opisthokonta. The new alignment included six Metazoa, six Fungi, and three other eukaryotes. We used BLAST to search for the corresponding proteins of the new taxa in the databases (for further details, see the supplementary file 1, Supplementary Material online). Each protein domain was then aligned using MAFFT (Katoh et al. 2002) with default parameters. The alignments were ranked using the “sum-of-pairs score,” a metric that is used to predict the quality of an alignment (Ahola et al. 2008) (supplementary table S5 in supplementary file 1, Supplementary Material online). To assure orthology, only the first 90 protein domains in this list were selected allowing us to select for the best alignments and thus the most conserved domains. Thereafter, to check whether some domains were usually associated within the same protein, PFAM analyses were carried out on the basis of N. vectensis, M. brevicollis, and B. dendrobatidis proteomes (see supplementary file 1, Supplementary Material online). This resulted in some individual alignments that included two different protein domains. By excluding these from consideration, the number of total alignments was reduced to 82. Finally, when possible, the alignments were further extended at the N or C termini to include conserved regions beyond the boundaries of the PFAM domain.
Data Curation
After the automatic steps described above, each of the 82 alignments was checked by eye. The final taxonomic sample included 58 taxa: 21 Metazoa, 19 Fungi, and 18 other eukaryotes (supplementary table S6 in supplementary file 1, Supplementary Material online). After the selection of the protein domain alignments, sequences for the additional taxa were obtained using tBLASTx for each of our protein domains against their proteomes. In addition, sequences that were not found in the proteomes were searched using tBLASTn against genomes.
Putative errors of protein prediction were detected in the alignments and corrected by performing new protein predictions based on genomic sequences using GENSCAN (Burge and Karlin 1997) and the ExPaSy Proteomics Server Translate tool (Gasteiger et al. 2003). At this point, three of the protein domain alignments were removed from the data set due to indels in some taxa that resulted in short conserved sequences. If possible, when a sequence was missing (or largely incomplete) for any given species, we added a sequence from a closely related species to the alignment (e.g., as in the case of the Oscarella and Acropora chimeric concatenated sequence; see supplementary file 1: table S7 for additional details, Supplementary Material online).
All alignments were again realigned with MAFFT, and single-gene phylogenetic trees were inferred using PhyML 3.0 (Guindon and Gascuel 2003) with the LG evolutionary model (Le and Gascuel 2008) and eight gamma rate categories. In the few instances in which species showed more than one copy of a marker due to lineage-specific duplications/diversifications (and they were grouping together in the single domain trees), only the sequence with the shortest branch to the outgroup was retained. Since these different copies represent recent lineage-specific domain duplications, they will not mislead the phylogenetic inference. Finally, after all single domain trees were checked for evidence of complex evolutionary histories, only one of the alignments was discarded for presenting a potential paralogy problem.
The remaining 78 protein domain alignments were realigned once more with MAFFT using default parameters. They were again checked by eye, trimmed by Gblocks 0.91 (Castresana 2000) with default parameters and finally concatenated. In the end, the supermatrix consisted of 78 independent alignments representing 93 conserved single-copy protein domains for 58 taxa. The matrix contained 18,106 amino acid positions (see supplementary table S8 in supplementary file 1, Supplementary Material online).
Saturation Test and Taxon Occupancy
The saturation plots were calculated for the original data sets 1 and 3, as well as the data sets derived from these by exclusion of the fastest evolving sites or recoding into functional categories. These consisted of scatter plots based on p-distances (pairwise observed distances) calculated with MEGA 4.1 (Kumar et al. 2008) plotted against the ML distances inferred from the Whelan and Goldman model of evolution (Whelan and Goldman 2001) including a gamma distribution of four rate categories (WAG + GAMMA) that were estimated with Tree-puzzle 5.2 (Schmidt et al. 2002). The resulting curve showed the degree of substitutional saturation qualitatively (see supplementary graphs S9 in supplementary file 2, Supplementary Material online).
Taxon occupancy (Hejnol et al. 2009; Sanderson et al. 2010), which is an approximate estimation of the degree of asymmetry within the matrix or the effect of the missing data, was calculated by summing the percentage of taxa present for each individual domain alignment and dividing the result by the total number of domain alignments (supplementary table S10 in supplementary file 2, Supplementary Material online).
The Outgroup Choice
The supermatrix contained a good sampling of Opisthokonta, Amoebozoa as well as some representatives of Stramenopiles and Viridiplantae (Cavalier-Smith 1998; Adl et al. 2005) to root the tree (Wheeler 1990; Huelsenbeck et al. 2002). In addition to the original alignment, three other supermatrices were created, each with reduced taxon sampling to test the impact of a closer outgroup on the topology recovered. The final data sets were as follows: 1) the original matrix with 58 taxa, Unikonta as the ingroup and Stramenopiles and Viridiplantae as the outgroup (Data set 1); 2) a data set with Amoebozoa and Apusozoa as the outgroup to Opisthokonta with a total of 52 taxa (Data set 2); 3) a data set with 36 taxa to specifically assess the branching order of Holozoa, in which a few representative Fungi were used as an outgroup (Data set 3); and 4) a 28 taxon data set to address the phylogeny of early divergent Fungi, using a few representative holozoan species as the outgroup (Data set 4).
Recoding into Functional Categories
To reduce the potential systematic error associated with compositional bias, a recoding approach was tested as described in Rodriguez-Ezpeleta et al. (2007) and Ruiz-Trillo et al. (2008). For each of the four data sets, the 20 amino acid characters were manually recoded into four chemically related categories to obtain the specific recoded data sets. The categories were based on the six Dayhoff groups (ASTGP, DNEQ, RKH, MVIL, FYW, and C [Dayhoff 1978]). However, there were two modifications to allow for a general time reversible (GTR) matrix, as implemented in most programs: aromatic (FYW) and hydrophobic (MVIL) were combined in the same category, and the rare cysteines were coded as missing data.
Effects of Missing Data
To test the impact of missing data that resulted from the inclusion of EST data, two extra data sets were created for each of the four original ones. In the first extra data set, taxa with more than 45% of missing data were excluded (corresponding to the seven taxa whose sequences were derived from EST data). In the second data set, all taxa with more than 10% missing data were excluded (supplementary table S12 in supplementary file 2, Supplementary Material online).
Removal of Fast-Evolving Sites
The four data sets were analyzed by ML under the WAG + GAMMA model with the quartet puzzling algorithm (Strimmer and von Haeseler 1996) using Tree-puzzle 5.2 (Schmidt et al. 2002) to classify all sites into eight discrete categories of the gamma distribution. To reduce the computational burden and avoid problems with missing data, these analyses were performed by excluding taxa with more than 10% missing data (see the section above). Using the estimated site-rate categories from the quartet puzzling algorithm, two additional data sets were generated using the masking option on BioEdit (Hall 1999) to test the effect of progressive removal of fast-evolving sites. In one data set, positions classified as category 8 (the fastest-evolving sites) were excluded; in the other positions classified as categories 7 and 8 were excluded (see supplementary table S11 in supplementary file 3, Supplementary Material online).
Phylogenetic Analyses
ML trees were inferred using RAxML 7.2.8 parallel Pthreads-based version (Stamatakis 2006). The four main data sets were analyzed both with the WAG + GAMMA and the LG + GAMMA models. The data sets recoded into functional categories were analyzed using the generalized time reversible model (Lanave et al. 1984) (GTR + GAMMA). Runs started from four random trees, using subtree pruning and regrafting for branch swapping and the rapid hill-climbing algorithm (Stamatakis et al. 2007). ML analyses were also performed using 78 partitions for each of the genes in the main data sets. Rather than the fast-bootstrap feature of RAxML, the statistical support was assessed by performing 500 nonparametric bootstrap replicates with the same parameters as used in the initial tree search (see supplementary file 3, Supplementary Material online).
BI trees were constructed using the “Automatic stopping rule” with the default parameters as implemented in PhyloBayes 3.2 (Blanquart and Lartillot 2006, 2008) under the site-heterogeneous CAT evolutionary model (Lartillot and Philippe 2004). We chose the CAT-Poisson option, since it is a complex model that captures the diversity of site profiles in the data set without being overparameterized. To evaluate statistical support for splits, in addition to posterior probabilities, 100 jackknife pseudo replicates were obtained using SEQBOOT from the PHYLIP package (Felsenstein 1989) keeping 60% of positions. For each of these, a single Markov Chain Monte Carlo run was performed with 6,000 cycles using PhyloBayes. Thereafter, a burn-in of 3,000 cycles were applied to obtain a consensus tree for each chain (see main figs. 2–5).
FIG. 2.

Phylogenetic tree from BI for the data set 1. Stramenopiles and Viridiplantae are the outgroup. The numbers on branches indicate, from left to right, the following statistical support values: nonparametric bootstrap using WAG model (ML analysis with 500 replicates), nonparametric bootstrap using LG model (ML analysis with 500 replicates), posterior probability using CAT model (BI analysis), and delete 40% jackknife using CAT model (BI analysis). Nodes with maximum support values for all four analyzes (100 nonparametric bootstraps, 1 posterior probability and 100 jackknife runs) are depicted with black circles. Clades without support are marked with “-.”
FIG. 3.

Phylogenetic tree from BI for data set 2. Amoebozoa and Apusozoa are the outgroup. The numbers on branches indicate, from left to right, the following statistical support values: nonparametric bootstrap using WAG model (ML analysis with 500 replicates), nonparametric bootstrap using LG model (ML analysis with 500 replicates), posterior probability using CAT model (BI analysis), and delete 40% jackknife using CAT model (BI analysis). Nodes with maximum support values for all four analyzes (100 nonparametric bootstraps, 1 posterior probability, and 100 jackknife runs) are depicted with black circles. Clades without support are marked with “-.”
FIG. 4.

Phylogenetic tree from BI for data set 3. Fungi is the outgroup. The numbers on branches indicate, from left to right, the following statistical support values: nonparametric bootstrap using WAG model (ML analysis with 500 replicates), nonparametric bootstrap using LG model (ML analysis with 500 replicates), posterior probability using CAT model (BI analysis), and delete 40% jackknife using CAT model (BI analysis). Nodes with maximum support values for all four analyzes (100 nonparametric bootstraps, 1 posterior probability and 100 jackknife runs) are depicted with black circles. Clades without support are marked with “-.”
FIG. 5.
Phylogenetic tree from BI for data set 4. Holozoa is the outgroup. The numbers on branches indicate, from left to right, the following statistical support values: nonparametric bootstrap using WAG model (ML analysis with 500 replicates), nonparametric bootstrap using LG model (ML analysis with 500 replicates), posterior probability using CAT model (BI analysis), and delete 40% jackknife using CAT model (BI analysis). Nodes with maximum support values for all four analyzes (100 nonparametric bootstraps, 1 posterior probability and 100 jackknife runs) are depicted with black circles. Clades without support are marked with “-.”
Comparison of Topologies
Topologies estimated by ML can be compared using a number of statistical tests including the approximately unbiased (AU) test (Shimodaira 2002). Using the best ML tree from each data set, we prepared a series of specific node constraints with TreeView (Page 1996) to evaluate alternative topologies (e.g., we constrained Ichthyosporea to be the sister group to Filasterea and other Holozoa). The topologies were either based on previous studies or considered to be hypotheses of interest. First, RAxML was used to recalculate the optimal topology for each constraint and to calculate the site likelihoods for each tree. Then, the AU test was performed using CONSEL (Shimodaira and Hasegawa 2001) with the default scaling and replicate values (supplementary table S13 in supplementary file 2, Supplementary Material online).
Results
A New Data Set
To avoid orthology assignment problems, we constructed a novel supermatrix based on conserved single-copy domains (see the Materials and Methods and supplementary table S8 in supplementary file 1, Supplementary Material online). This data set represents an independent matrix for phylogenomic analysis since it shares less than 10% with other published eukaryotic phylogenomic data sets (see supplementary table S2 in supplementary file 1, Supplementary Material online). We performed ML and BI analyses to test previous hypotheses about the phylogenetic position of primary divergent lineages within Holozoa, Metazoa, and Fungi. A series of different data sets were analyzed to assess the effect of outgroup choice on the results for each phylogenetic question evaluated.
Data Set 1: Stramenopiles and Viridiplantae as Outgroup to Unikonta
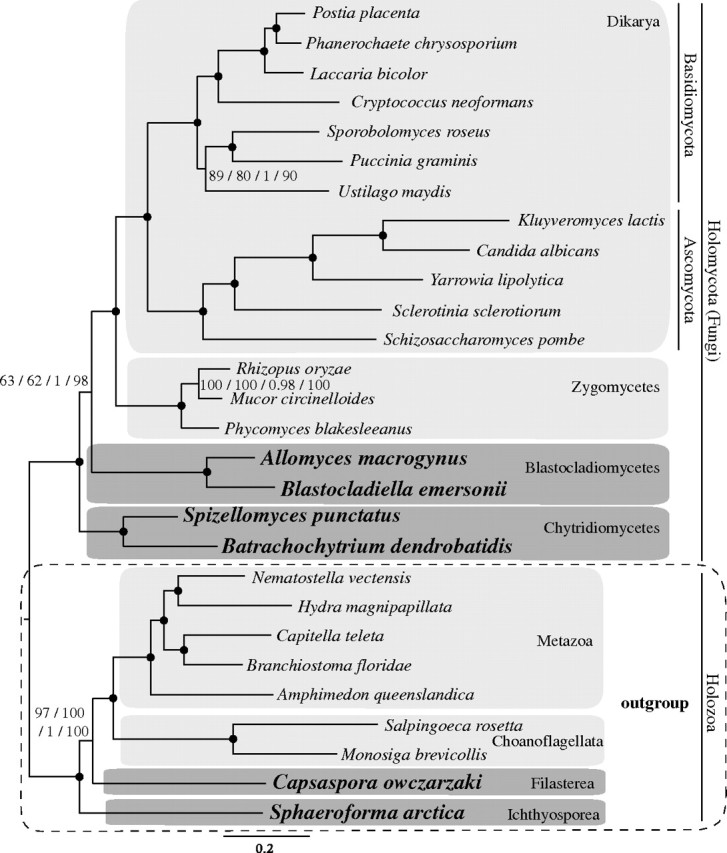
The substitutional saturation plot for the original data set shows that the observed distances are, in general, proportional to the corrected distances without reaching a clear plateau, indicating that the data set does not display significant saturation (supplementary graphs S9a, c, and e in supplementary file 2, Supplementary Material online). Moreover, the average taxon occupancy is 90.78% of taxa per alignment (supplementary table S10 in supplementary file 2, Supplementary Material online), which is high relative to most published phylogenomic analyses.
The BI tree inferred with the CAT-Poisson model recovers the Amoebozoa, Apusozoa, and Opisthokonta as a clade (the Unikonta). In this analysis, the apusozoan T. trahens clearly branches as the sister group to the opisthokonts (fig. 2), but given that there is only one representative for this group, a firm conclusion cannot be drawn at this time point with confidence. A discussion of phylogenomic results with broader species sampling and a mitochondrial protein set will be presented elsewhere.
Within Opisthokonta, Fungi appear as the sister group to a monophyletic Holozoa. Within Fungi, the Chytridiomycetes emerge as the earliest-branching fungal lineage, to the exclusion of the clade formed by the Blastocladiomycetes and the remaining fungi with a posterior probability support value of PP = 0.99 and a jackknife value of JV = 81%. Within the Holozoa, the Filasterea emerge as the sister group to a Choanoflagellata and Metazoa group, with Ichthyosporea as the first-branching holozoan lineage (PP = 1; JV = 97%) supporting the Filozoa hypothesis (Ruiz-Trillo et al. 2008; Shalchian-Tabrizi et al. 2008; Liu et al. 2009). Within the Metazoa, sponges are recovered as the sister group to all the remaining animal phyla (PP = 0.88; JV = 59%), whereas Trichoplax adhaerens emerges as an independent lineage that forms a sister group to Cnidaria plus Bilateria.
Remarkably, the ML analyses under the WAG + GAMMA or LG + GAMMA models recovered several topologies that differed from the BI analyses employing the CAT model (fig. 2, supplementary figs. S1 and S3, Supplementary Material online). Specifically, the ML analyses grouped Ichthyosporea with Filasterea together, although with low-to-moderate bootstrap values (BV = 65% using WAG and 42% using LG) and place the placozoan T. adhaerens within sponges, with no statistical support (WAG BV = 38% and LG BV = 56%). For the partitioned analyses, the removal of taxa with the most missing data or the fastest-evolving sites (i.e., those belonging in rate category 8) made little difference to the results (see supplementary figs. S2, S5, S6, and S7 in supplementary file 3, Supplementary Material online). However, when the sites from both rate categories 7 and 8 were removed (supplementary fig. S8, Supplementary Material online), Filasterea appeared as the sister group to Choanoflagellata and Metazoa (BV = 44%) to the exclusion of Ichthyosporea. Interestingly, the analysis with the amino acid positions recoded into functional categories had the same outcome as the removal of the two fastest-evolving site categories, although with low statistical support. The recoding analyses moderately supported the Filozoa hypothesis (BV = 63%) and the Chytridiomycetes as the earliest-branching fungal lineage (BV = 46%, see supplementary fig. S4 and table S11 in supplementary file 3, Supplementary Material online for an overall view of all analyses performed for all data sets).
Data Set 2: Amoebozoa and Apusozoa as the Outgroup to Opisthokonta
The BI tree estimated with the CAT model for this data set, in which Amoebozoa and a single Apusozoa species were used as the outgroup to Opisthokonta, had a very similar topology to the data set 1 for the nodes of interest. The following were supported: the Filozoa hypothesis (PP = 1; JV = 96%), the Blastocladiomycota hypothesis (PP = 1; JV = 95%), and the branching of Placozoa as a sister group to Cnidaria (PP = 0.98; JV = 67%; see fig. 3).
The ML tree estimated using LG + GAMMA model also recovered the Filozoa (BV = 47%; see supplementary fig. S11, Supplementary Material online). In contrast, the WAG + GAMMA model analysis recovered the Ichthyosporea and the Filasterea grouping together at the base of Holozoa, with low statistical support (BV = 58%; see supplementary fig. S9, Supplementary Material online).
The ML analyses of data set 2 revealed a different topology for basal Fungi than that recovered by BI, with Chytridiomycetes as the sister group to Blastocladiomycetes (BV = 63% for WAG and 55% for LG). Finally, in contrast to the BI tree, T. adhaerens was located between Porifera and Cnidaria as an independent lineage but with no statistical support in the ML analyses (supplementary figs. S9 and S11, Supplementary Material online). Similar to the analyses of data set 1, partitioning the data set, the exclusion of the taxa with the most missing data or removal of the fastest-evolving sites did not have much impact on the results (supplementary table S11 and figs. S10, S13–S15, Supplementary Material online). Only the exclusion of sites with rate categories 7 and 8 (supplementary fig. S16, Supplementary Material online) and the recoding of amino acid positions into functional categories (supplementary fig. S12, Supplementary Material online) affected the topology recovered. In this case, Ichthyosporea appeared as the sister group to the rest of Holozoa, although with low statistical support (the Filozoa hypothesis with BV = 76% for recoding and BV = 42% for removing the fastest positions), and Placozoa was recovered as a sister group to Cnidaria (BV = 76% in the recoding analysis).
Data Set 3: Fungi as an Outgroup to Holozoa
This data set was specifically designed to assess the branching order of the first holozoan lineages. Like data set 1, the saturation analysis of data set 3 showed even less substitutional saturation in the amino acid composition between species (see supplementary graphs 9b, d, and f in supplementary file 2, Supplementary Material online). The ML and BI analyzes both showed, with reasonable statistical support (fig. 4), Ichthyosporea as the first lineage to branch off the Holozoa followed by the Filozoa (BV = 94% for WAG; BV = 89% for LG; PP = 0.95; JV = 100%; see supplementary table S11 and figs. S17–S19 in supplementary file 3, Supplementary Material online). This topology is in contrast to most of the ML trees inferred from data sets 1 and 2 that had a more distantly related outgroup. Importantly, analyses of data set 3 also recovered Placozoa as a sister group to Eumetazoa (Cnidaria + Bilateria) in both the BI (PP = 0.99; JV = 90%) and the ML trees (BV = 42% for WAG; BV = 55% for LG; see fig. 4, supplementary figs. S17 and S19, Supplementary Material online). Similar to the other data sets, partitioned analyses had the same result (supplementary fig. S18, Supplementary Material online). However, the position of T. adhaerens changes to that of sister group to Cnidaria or to Porifera when the amino acids are recoded into functional categories or when taxa with missing data are excluded, as well as when the fastest-evolving sites are removed (see supplementary table S11 and figs. S20–S23, Supplementary Material online).
Data Set 4: Holozoa as an Outgroup to the Fungi
Data set 4 (fig. 5) was specifically designed to assess the phylogeny of early-branching Fungi. The BI tree shows Chytridiomycetes as the sister group to the remaining Fungi (PP = 1; JV = 98%), according to the BI trees inferred by data sets 1 and 2. The same topology was obtained on the ML trees with WAG and LG models, although with low statistical support (BV = 63% and 62%; supplementary figs. S25 and S27, Supplementary Material online). The statistical support for this topology increased when data were recoded into functional categories (BV = 87%; see supplementary fig. S28, Supplementary Material online) or when the fastest-evolving sites were excluded (both BV = 78%; see supplementary figs. S31 and S32, Supplementary Material online). Interestingly, the analyses of the data set that excluded the taxa with the most missing data (supplementary figs. S29 and S30, Supplementary Material online) did not estimate this topology but did show the grouping of Blastocladiomycetes and Chytridiomycetes (BV = 57% and 58%, respectively).
Comparison of Topologies
To test whether alternative topologies can be statistically rejected, the AU test (Shimodaira 2002) was used for each data set. The test did not significantly exclude most of the tested alternative topologies, except for Placozoa placed as the sister group to Bilateria, which was rejected for all the data sets (with P values < 0.05) and Blastocladiomycetes as the sister group to Chytridiomycetes and other Fungi, which was rejected for data sets 2 and 3 (supplementary table S13 in supplementary file 2, Supplementary Material online).
Discussion
A New Phylogenomic Data Set
Previous phylogenomic analyses of eukaryotes, the Opisthokonta, or the Metazoa, have inferred phylogenetic relationships that have since become widely accepted, such as Opisthokonta monophyly (Cavalier-Smith and Chao 1995; Lang et al. 2002; Medina et al. 2003; Ruiz-Trillo et al. 2004, 2006, 2008; Steenkamp et al. 2006; Shalchian-Tabrizi et al. 2008); the adjacency of Opisthokonta and Amoebozoa; or the sister group relationship between Choanoflagellata and Metazoa (Lang et al. 2002; Philippe et al. 2004; Ruiz-Trillo et al. 2008; Shalchian-Tabrizi et al. 2008). However, some specific relationships remain highly disputed and it was not clear whether this is a methodological problem or a consequence of rapid diversification having occurred in particular parts of the tree (i.e., the origin of Metazoa). Two possible causes of incongruence among published analyses are the use of data sets with limited taxon sampling and/or orthology miss-assignments. Here, we have tried to avoid both problems by using the widest taxon sampling to date for organisms with completed full genome or transcriptome sequences and using conserved single-copy domains as markers. Furthermore, as there is minimal overlap between the data set we assembled and those previously published (Philippe et al. 2004, 2009; Brinkmann et al. 2005; Burki et al. 2007; Ruiz-Trillo et al. 2008; Shalchian-Tabrizi et al. 2008), our analyses serve as an independent test of phylogenetic hypotheses. We used this data set to test hypotheses in three different parts of the opisthokont tree and to evaluate the effect of several methods that are assumed to minimize systematic errors, such as closing the outgroup, excluding the fastest-evolving positions, and recoding the amino acids into functional categories (Philippe 1997; Rodriguez-Ezpeleta et al. 2007; Ruiz-Trillo et al. 2008).
The Early-Branching Fungi
Our data show that the distance of outgroup sequences to the ingroup has a considerable impact on the topology of the Fungi, at least when using ML methods with standard protein models. Analysis of data set 4 (fig. 5), that uses only holozoan lineages as an outgroup, shows Chytridiomycetes as the sister group to the remaining Fungi, supporting previous multigene trees (James et al. 2000, 2006; Liu et al. 2009). In contrast, data sets 1 and 2, which have a distantly related outgroup, show Blastocladiomycetes as the sister group to Chytridiomycetes. Neither the recoding strategy nor excluding the fastest evolving sites showed strongly supported differences in recovered topologies. One possible explanation for this observation is that the phylogenetic signal for branches separating the early-branching Fungi is weak in our data set. Only by using the CAT mixture model and/or an adequate outgroup (less prone to suffer from substitutional saturation and compositional heterogeneity, respectively), a consensus relationship is recovered among most data sets analyzed, although with low statistical support. Unfortunately, the taxon sampling for Fungi in our data set remains very limited compared with other recent studies (James et al. 2006; Liu et al. 2009). In future, our results should be tested with wider fungal taxon sampling, including lineages closest to Fungi, such as the nucleariids and F. alba.
The Branching Order within Holozoa
There has been controversy over the branching order within Holozoa and, particularly, over whether Ichthyosporea is the sister group to Filasterea or to Filozoa. On balance, our data supports the Filozoa hypothesis (Ruiz-Trillo et al. 2008; Shalchian-Tabrizi et al. 2008; Liu et al. 2009) rather than a sister group relationship between Filasterea and Ichthyosporea (tentatively named in this manuscript “Filasporea”) (Ruiz-Trillo et al. 2008; Liu et al. 2009).
As with Fungi, the influence of outgroup choice is significant, with the closest outgroup-rooted analyses supporting the Filozoa hypothesis most strongly. The ML analyses only recover the Filozoa grouping with data set 3 (supplementary figs. S17 and S19, Supplementary Material online), which is also recovered by the CAT mixture model under BI (fig. 4). Use of the CAT model also has a considerable impact on the estimated topology as it also retrieves the Filozoa topology even when more distantly related outgroups are used, as in data sets 1 and 2 (figs. 2 and 3). A possible explanation is that the CAT model deals better with substitutional saturation (although not with compositional heterogeneity [Nesnidal et al. 2010]) than other models, such as WAG (Lartillot and Philippe 2008). Interestingly, the topology of Holozoa was also affected by recoding the amino acids into functional categories or by removing the fastest-evolving positions (categories 8 and 7). Both measures allowed recovery of Filozoa in analyses of data sets 1 and 2 (supplementary figs. S4, S8, S12, and S16 in supplementary file 3, Supplementary Material online), probably because they reduced error from substitutional saturation (see supplementary graphs 9a–f in supplementary file 2, Supplementary Material online).
The finding that Ichthyosporea is the sister group to the remaining Holozoa has deeper evolutionary implications. The filasterean C. owczarzaki has recently been shown to have several genes that are involved in multicellularity. These genes were previously believed to be metazoan specific (and are not present in Choanoflagellata) and include genes for integrins, T-box proteins (including a Brachyury type), or Runx (Sebé-Pedrós, de Mendoza, et al. 2010; Sebé-Pedrós, Roger, et al. 2010; Sebé-Pedrós and Ruiz-Trillo 2010). Thus, if Ichthyosporea is indeed the earliest branching lineage within the Holozoa, the importance of obtaining genome data from ichthyosporeans increases (Ruiz-Trillo et al. 2007), since the elucidation of the genetic machinery of Ichthyosporea will be crucial to pinpoint the evolutionary origins of these cell-adhesion and intercellular “communication” genes.
The Early Branching Metazoans
Finally, we tested how our new data set behaves with regard to the phylogeny of early-branching metazoans. To avoid problems with missing data, we only included diploblast phyla from which at least one complete genome sequence is available (i.e., Porifera, Placozoa, and Cnidaria). Unfortunately, our data set does not include Ctenophora, which has recently been proposed to be the earliest-branching metazoan phyla (Dunn et al. 2008; Hejnol et al. 2009; but see Philippe et al. 2009, 2011). Although most of the analyzes fail to provide a strongly supported answer to the branching order of diploblastic metazoans, mainly due to the unstable position of T. adhaerens, the CAT model and a close outgroup provide a moderately well-supported topology (fig. 4). Although most of the trees (either with ML or BI estimation) show T. adhaerens as the sister group to Cnidaria (see fig 3 and supplementary table S11 for summary, Supplementary Material online), the ML and especially the BI analyses for data set 3 show Placozoa in an intermediate position between sponges and cnidarians, that is, as a sister group to the Eumetazoa (Cnidaria + Bilateria). Since other Holozoa interrelationships are well resolved with this data set, we suggest an emergence between sponges and cnidarians is the most likely position of T. adhaerens, although we cannot rule out a sister group relationship this organism and Cnidaria. In fact, this position as sister group to Eumetazoa could explain that the T. adhaerens genome seems to encode a gene repertoire in between what it is found in sponges and cnidarians for some gene families such as MAGUK, bHLH, or homeobox, although secondary gene loss can not be ruled out (Schierwater et al. 2008; Srivastava et al. 2008; de Mendoza et al. 2010; Sebé-Pedrós, de Mendoza, et al. 2010; Ryan et al. 2010). In any case, further phylogenomic analyses should be carried out with more sponges and with at least one representative of the phylum Ctenophora to test whether this phylogenetic position is stable.
Conclusions
Our data show that concatenated alignments of protein domains rather than genes or complete proteins are a useful alternative strategy for inferring phylogenies and testing previous hypotheses that minimizes potential orthology assignment issues. We found that the selected evolutionary model and the outgroup have a considerable impact on the recovery of deep phylogenetic relationships within the opisthokonts. Other methods that are known to minimize systematic errors, such as recoding the amino acid into functional categories, or excluding the fastest-evolving sites have less impact but still provide important information regarding the kinds and locations of conflicting signals within data sets. Interestingly, our data supports the group Filozoa (Shalchian-Tabrizi et al. 2008) whereby Ichthyosporea are the sister group of the remaining Holozoa and do not branch as the sister group to Filasterea. We also find that the Chytridiomycetes may be the sister group to the rest of Fungi (James et al. 2006; Liu et al. 2009), although our taxon sampling is very limited. Finally, we find some support for the placement of Placozoa as occupying an intermediate position between Porifera and Cnidaria (Srivastava et al. 2008) or as a sister group to Cnidaria (Cavalier-Smith and Chao 2003). Although more analyses are certainly needed, our new approach based on conserved single-copy protein domains has proved to be an invaluable independent data set to infer phylogenies. As new genome or complete transcriptome sequences become available, this new data set can be expanded and further tested.
Supplementary Material
Supplementary files 1–3 are available at Molecular Biology and Evolution online (http://www.mbe.oxfordjournals.org/)
Acknowledgments
The genome sequences of C. owczarzaki, A. macrogynus, S. punctatus, S. rosetta, and T. trahens are being determined by the Broad Institute of MIT/Harvard University under the auspices of the National Human Genome Research Institute (NHGRI) and within the UNICORN initiative. We thank JGI, BI, and BCM for making data publicly available and Dr Nicole King for allowing us to use unpublished data from S. rosetta. We also thank Dr Kim Worley and her colleagues in the Human Genome Sequencing Center of Baylor College of Medicine for allowing us to use A. castellanii genome sequence. The A. castellanii sequencing was funded by grant U54 HG003273 from NHGRI, National Institutes of Health to Richard Gibbs. We thank Hiroshi Suga, Arnau Sebé-Pedrós, and Alexandre de Mendoza for helpful insights. We also thank Ares Rocañín for her personal support. K.S.-T. thanks University of Oslo and Research Council of Norway for research grants. A.J.R. acknowledges support from the Canada Research Chairs Program. This work was supported by an ICREA contract, an European Research Council Starting Grant (ERC-2007-StG-206883) and a grant (BFU2008-02839/BMC) from Ministerio de Ciencia e Innovación (MICINN) to I.R.-T. G.T.’s work was supported by a pre-graduate FI grant from Generalitat de Catalunya (AGAUR).
References
- Adl SM, Simpson AG, Farmer MA, et al. The new higher level classification of eukaryotes with emphasis on the taxonomy of protists. J Eukaryot Microbiol. (28 co-authors). 2005;52:399–451. doi: 10.1111/j.1550-7408.2005.00053.x. [DOI] [PubMed] [Google Scholar]
- Aguinaldo AM, Turbeville JM, Linford LS, Rivera MC, Garey JR, Raff RA, Lake JA. Evidence for a clade of nematodes, arthropods and other moulting animals. Nature. 1997;387:489–493. doi: 10.1038/387489a0. [DOI] [PubMed] [Google Scholar]
- Ahola V, Aittokallio T, Vihinen M, Uusipaikka E. Model-based prediction of sequence alignment quality. Bioinformatics. 2008;24:2165–2171. doi: 10.1093/bioinformatics/btn414. [DOI] [PubMed] [Google Scholar]
- Aleshin VV, Konstantinova AV, Mikhailov KV, Nikitin MA, Petrov NB. Do we need many genes for phylogenetic inference? Biochemistry (Mosc) 2007;72:1313–1323. doi: 10.1134/s000629790712005x. [DOI] [PubMed] [Google Scholar]
- Baldauf SL, Palmer JD. Animals and fungi are each other’s closest relatives: congruent evidence from multiple proteins. Proc Natl Acad Sci U S A. 1993;90:11558–11562. doi: 10.1073/pnas.90.24.11558. [DOI] [PMC free article] [PubMed] [Google Scholar]
- Blanquart S, Lartillot N. A Bayesian compound stochastic process for modeling nonstationary and nonhomogeneous sequence evolution. Mol Biol Evol. 2006;23:2058–2071. doi: 10.1093/molbev/msl091. [DOI] [PubMed] [Google Scholar]
- Blanquart S, Lartillot N. A site- and time-heterogeneous model of amino acid replacement. Mol Biol Evol. 2008;25:842–858. doi: 10.1093/molbev/msn018. [DOI] [PubMed] [Google Scholar]
- Bridge D, Cunningham CW, DeSalle R, Buss LW. Class-level relationships in the phylum Cnidaria: molecular and morphological evidence. Mol Biol Evol. 1995;12:679–689. doi: 10.1093/oxfordjournals.molbev.a040246. [DOI] [PubMed] [Google Scholar]
- Brinkmann H, van der Giezen M, Zhou Y, Poncelin de Raucourt G, Philippe H. An empirical assessment of long-branch attraction artefacts in deep eukaryotic phylogenomics. Syst Biol. 2005;54:743–757. doi: 10.1080/10635150500234609. [DOI] [PubMed] [Google Scholar]
- Brown MW, Spiegel FW, Silberman JD. Phylogeny of the “forgotten” cellular slime mold, Fonticula alba, reveals a key evolutionary branch within Opisthokonta. Mol Biol Evol. 2009;26:2699–2709. doi: 10.1093/molbev/msp185. [DOI] [PubMed] [Google Scholar]
- Burge C, Karlin S. Prediction of complete gene structures in human genomic DNA. J Mol Biol. 1997;268:78–94. doi: 10.1006/jmbi.1997.0951. [DOI] [PubMed] [Google Scholar]
- Burki F, Shalchian-Tabrizi K, Minge M, Skjaeveland A, Nikolaev SI, Jakobsen KS, Pawlowski J. Phylogenomics reshuffles the eukaryotic supergroups. PLoS One. 2007;2:e790. doi: 10.1371/journal.pone.0000790. [DOI] [PMC free article] [PubMed] [Google Scholar]
- Caetano-Anolles G, Caetano-Anolles D. An evolutionarily structured universe of protein architecture. Genome Res. 2003;13:1563–1571. doi: 10.1101/gr.1161903. [DOI] [PMC free article] [PubMed] [Google Scholar]
- Castresana J. Selection of conserved blocks from multiple alignments for their use in phylogenetic analysis. Mol Biol Evol. 2000;17:540–552. doi: 10.1093/oxfordjournals.molbev.a026334. [DOI] [PubMed] [Google Scholar]
- Cavalier-Smith T. The origin of fungi and pseudofungi. In: Rayner ADM, Brasier CM, Moore D, editors. Evolutionary biology of the fungi. Cambridge: Cambridge University Press; 1987. pp. 339–353. [Google Scholar]
- Cavalier-Smith T. A revised six-kingdom system of life. Biol Rev Camb Philos Soc. 1998;73:203–266. doi: 10.1017/s0006323198005167. [DOI] [PubMed] [Google Scholar]
- Cavalier-Smith T. The phagotrophic origin of eukaryotes and phylogenetic classification of Protozoa. Int J Syst Evol Microbiol. 2002;52:297–354. doi: 10.1099/00207713-52-2-297. [DOI] [PubMed] [Google Scholar]
- Cavalier-Smith T, Chao EE. The opalozoan Apusomonas is related to the common ancestor of animals, fungi, and choanoflagellates. Proc R Soc Lond B Biol Sci. 1995;261:1–6. [Google Scholar]
- Cavalier-Smith T, Chao EE. Phylogeny of choanozoa, apusozoa, and other protozoa and early eukaryote megaevolution. J Mol Evol. 2003;56:540–563. doi: 10.1007/s00239-002-2424-z. [DOI] [PubMed] [Google Scholar]
- Cavalier-Smith T, Chao EE. 2010. Phylogeny and Evolution of Apusomonadida (Protozoa: Apusozoa): New Genera and Species. Protist. 161:549–576. [DOI] [PubMed] [Google Scholar]
- Dayhoff MO. Atlas of protein sequence and structure. Washington (DC): National Biomedical Research Foundation; 1978. [Google Scholar]
- de la Torre-Barcena JE, Kolokotronis SO, Lee EK, Stevenson DW, Brenner ED, Katari MS, Coruzzi GM, DeSalle R. The impact of outgroup choice and missing data on major seed plant phylogenetics using genome-wide EST data. PLoS One. 2009;4:e5764. doi: 10.1371/journal.pone.0005764. [DOI] [PMC free article] [PubMed] [Google Scholar]
- de Mendoza A, Suga H, Ruiz-Trillo I. Evolution of the MAGUK protein gene family in premetazoan lineages. BMC Evol Biol. 2010;10:93. doi: 10.1186/1471-2148-10-93. [DOI] [PMC free article] [PubMed] [Google Scholar]
- de Queiroz A, Gatesy J. The supermatrix approach to systematics. Trends Ecol Evol. 2007;22:34–41. doi: 10.1016/j.tree.2006.10.002. [DOI] [PubMed] [Google Scholar]
- Dellaporta SL, Xu A, Sagasser S, Jakob W, Moreno MA, Buss LW, Schierwater B. Mitochondrial genome of Trichoplax adhaerens supports placozoa as the basal lower metazoan phylum. Proc Natl Acad Sci U S A. 2006;103:8751–8756. doi: 10.1073/pnas.0602076103. [DOI] [PMC free article] [PubMed] [Google Scholar]
- Delsuc F, Brinkmann H, Philippe H. Phylogenomics and the reconstruction of the tree of life. Nat Rev Genet. 2005;6:361–375. doi: 10.1038/nrg1603. [DOI] [PubMed] [Google Scholar]
- Doolittle RF. The multiplicity of domains in proteins. Annu Rev Biochem. 1995;64:287–314. doi: 10.1146/annurev.bi.64.070195.001443. [DOI] [PubMed] [Google Scholar]
- Dunn CW, Hejnol A, Matus DQ, et al. Broad phylogenomic sampling improves resolution of the animal tree of life. Nature. (18 co-authors). 2008;452:745–749. doi: 10.1038/nature06614. [DOI] [PubMed] [Google Scholar]
- Ender A, Schierwater B. Placozoa are not derived cnidarians: evidence from molecular morphology. Mol Biol Evol. 2003;20:130–134. doi: 10.1093/molbev/msg018. [DOI] [PubMed] [Google Scholar]
- Felsenstein J. PHYLIP—Phylogeny Inference Package (Version 3.2) Cladistics. 1989;5:164–166. [Google Scholar]
- Gabaldon T. Large-scale assignment of orthology: back to phylogenetics? Genome Biol. 2008;9:235. doi: 10.1186/gb-2008-9-10-235. [DOI] [PMC free article] [PubMed] [Google Scholar]
- Gasteiger E, Gattiker A, Hoogland C, Ivanyi I, Appel RD, Bairoch A. ExPASy: the proteomics server for in-depth protein knowledge and analysis. Nucleic Acids Res. 2003;31:3784–3788. doi: 10.1093/nar/gkg563. [DOI] [PMC free article] [PubMed] [Google Scholar]
- Gatesy J, DeSalle R, Wahlberg N. How many genes should a systematist sample? Conflicting insights from a phylogenomic matrix characterized by replicated incongruence. Syst Biol. 2007;56:355–363. doi: 10.1080/10635150701294733. [DOI] [PubMed] [Google Scholar]
- Guindon S, Gascuel O. A simple, fast, and accurate algorithm to estimate large phylogenies by maximum likelihood. Syst Biol. 2003;52:696–704. doi: 10.1080/10635150390235520. [DOI] [PubMed] [Google Scholar]
- Hall TA. BioEdit: a user-friendly biological sequence alignment editor and analysis program for Windows 95/98/NT. Nucleic Acids Symp Ser. 1999;41:95–98. [Google Scholar]
- Hejnol A, Obst M, Stamatakis A, et al. Assessing the root of bilaterian animals with scalable phylogenomic methods. Proc Biol Sci. (17 co-authors). 2009;276:4261–4270. doi: 10.1098/rspb.2009.0896. [DOI] [PMC free article] [PubMed] [Google Scholar]
- Huang J, Xu Y, Gogarten JP. The presence of a haloarchaeal type tyrosyl-tRNA synthetase marks the opisthokonts as monophyletic. Mol Biol Evol. 2005;22:2142–2146. doi: 10.1093/molbev/msi221. [DOI] [PubMed] [Google Scholar]
- Huelsenbeck JP, Bollback JP, Levine AM. Inferring the root of a phylogenetic tree. Syst Biol. 2002;51:32–43. doi: 10.1080/106351502753475862. [DOI] [PubMed] [Google Scholar]
- James TY, Letcher PM, Longcore JE, Mozley-Standridge SE, Porter D, Powell MJ, Griffith GW, Vilgalys R. A molecular phylogeny of the flagellated fungi (Chytridiomycota) and description of a new phylum (Blastocladiomycota) Mycologia. 2006;98:860–871. doi: 10.3852/mycologia.98.6.860. [DOI] [PubMed] [Google Scholar]
- James TY, Porter D, Leander CA, Vilgalys R, Longcore JE. Molecular phylogenetics of the Chytridiomycota supports the utility of ultrastructural data in chytrid systematics. Can J Bot. 2000;78:336–350. [Google Scholar]
- Jeffroy O, Brinkmann H, Delsuc F, Philippe H. Phylogenomics: the beginning of incongruence? Trends Genet. 2006;22:225–231. doi: 10.1016/j.tig.2006.02.003. [DOI] [PubMed] [Google Scholar]
- Jenner RA, Littlewood DT. Problematica old and new. Philos Trans R Soc Lond B Biol Sci. 2008;363:1503–1512. doi: 10.1098/rstb.2007.2240. [DOI] [PMC free article] [PubMed] [Google Scholar]
- Katoh K, Misawa K, Kuma K, Miyata T. MAFFT: a novel method for rapid multiple sequence alignment based on fast Fourier transform. Nucleic Acids Res. 2002;30:3059–3066. doi: 10.1093/nar/gkf436. [DOI] [PMC free article] [PubMed] [Google Scholar]
- King N. The unicellular ancestry of animal development. Dev Cell. 2004;7:313–325. doi: 10.1016/j.devcel.2004.08.010. [DOI] [PubMed] [Google Scholar]
- Kumar S, Nei M, Dudley J, Tamura K. MEGA: a biologist-centric software for evolutionary analysis of DNA and protein sequences. Brief Bioinform. 2008;9:299–306. doi: 10.1093/bib/bbn017. [DOI] [PMC free article] [PubMed] [Google Scholar]
- Lanave C, Preparata G, Saccone C, Serio G. A new method for calculating evolutionary substitution rates. J Mol Evol. 1984;20:86–93. doi: 10.1007/BF02101990. [DOI] [PubMed] [Google Scholar]
- Lang BF, O'Kelly C, Nerad T, Gray MW, Burger G. The closest unicellular relatives of animals. Curr Biol. 2002;12:1773–1778. doi: 10.1016/s0960-9822(02)01187-9. [DOI] [PubMed] [Google Scholar]
- Lartillot N, Philippe H. A Bayesian mixture model for across-site heterogeneities in the amino-acid replacement process. Mol Biol Evol. 2004;21:1095–1109. doi: 10.1093/molbev/msh112. [DOI] [PubMed] [Google Scholar]
- Lartillot N, Philippe H. Improvement of molecular phylogenetic inference and the phylogeny of Bilateria. Philos Trans R Soc Lond B Biol Sci. 2008;363:1463–1472. doi: 10.1098/rstb.2007.2236. [DOI] [PMC free article] [PubMed] [Google Scholar]
- Le SQ, Gascuel O. An improved general amino acid replacement matrix. Mol Biol Evol. 2008;25:1307–1320. doi: 10.1093/molbev/msn067. [DOI] [PubMed] [Google Scholar]
- Liu Y, Steenkamp ET, Brinkmann H, Forget L, Philippe H, Lang BF. Phylogenomic analyzes predict sistergroup relationship of nucleariids and fungi and paraphyly of zygomycetes with significant support. BMC Evol Biol. 2009;9:272. doi: 10.1186/1471-2148-9-272. [DOI] [PMC free article] [PubMed] [Google Scholar]
- Medina M, Collins AG, Taylor JW, Valentine JW, Lipps JH, Amaral-Zettler L, Sogin ML. Phylogeny of Opisthokonta and the evolution of multicellularity and complexity in Fungi and Metazoa. Int J Astrobiol. 2003;2:203–211. [Google Scholar]
- Mendoza L, Taylor JW, Ajello L. The class mesomycetozoea: a heterogeneous group of microorganisms at the animal-fungal boundary. Annu Rev Microbiol. 2002;56:315–344. doi: 10.1146/annurev.micro.56.012302.160950. [DOI] [PubMed] [Google Scholar]
- Minge MA, Silberman JD, Orr RJ, Cavalier-Smith T, Shalchian-Tabrizi K, Burki F, Skjaeveland A, Jakobsen KS. Evolutionary position of breviate amoebae and the primary eukaryote divergence. Proc Biol Sci. 2009;276:597–604. doi: 10.1098/rspb.2008.1358. [DOI] [PMC free article] [PubMed] [Google Scholar]
- Nesnidal M, Helmkampf M, Bruchhaus I, Hausdorf B. Compositional heterogeneity and phylogenomic inference of metazoan relationships. Mol Biol Evol. 2010;27:2095–2104. doi: 10.1093/molbev/msq097. [DOI] [PubMed] [Google Scholar]
- Page RD. TreeView: an application to display phylogenetic trees on personal computers. Comput Appl Biosci. 1996;12:357–358. doi: 10.1093/bioinformatics/12.4.357. [DOI] [PubMed] [Google Scholar]
- Paps J, Ruiz-Trillo I. Encyclopedia of life sciences. Chichester (UK): John Wiley & Sons, Ltd p. 1–8; 2010. Animals and their unicellular ancestors. [Google Scholar]
- Patterson DJ. The diversity of eukaryotes. Am Nat. 1999;154:S96–S124. doi: 10.1086/303287. [DOI] [PubMed] [Google Scholar]
- Philippe H. Rodent monophyly: pitfalls of molecular phylogenies. J Mol Evol. 1997;45:712–715. [PubMed] [Google Scholar]
- doi: 10.1371/journal.pbio.1000602. Philippe H, Brinkmann H, Lavrov DV, Littlewood DT, Manuel M, Worheide G, Baurain D. 2011. Resolving difficult phylogenetic questions: why more sequences are not enough. PLoS Biol 9: e1000602. [DOI] [PMC free article] [PubMed] [Google Scholar]
- Philippe H, Delsuc F, Brinkmann H, Lartillot N. Phylogenomics. Annu Rev Ecol Evol Syst. 2005;36:541–562. [Google Scholar]
- Philippe H, Derelle R, Lopez P, et al. Phylogenomics revives traditional views on deep animal relationships. Curr Biol. (29 co-authors). 2009;19:706–712. doi: 10.1016/j.cub.2009.02.052. [DOI] [PubMed] [Google Scholar]
- Philippe H, Snell EA, Bapteste E, Lopez P, Holland PW, Casane D. Phylogenomics of eukaryotes: impact of missing data on large alignments. Mol Biol Evol. 2004;21:1740–1752. doi: 10.1093/molbev/msh182. [DOI] [PubMed] [Google Scholar]
- Pick KS, Philippe H, Schreiber F, et al. (11 co-authors) Improved phylogenomic taxon sampling noticeably affects nonbilaterian relationships. Mol Biol Evol. 2010;27:1983–1987. doi: 10.1093/molbev/msq089. [DOI] [PMC free article] [PubMed] [Google Scholar]
- Ponting CP, Russell RR. The natural history of protein domains. Annu Rev Biophys Biomol Struct. 2002;31:45–71. doi: 10.1146/annurev.biophys.31.082901.134314. [DOI] [PubMed] [Google Scholar]
- Rodriguez-Ezpeleta N, Brinkmann H, Roure B, Lartillot N, Lang BF, Philippe H. Detecting and overcoming systematic errors in genome-scale phylogenies. Syst Biol. 2007;56:389–399. doi: 10.1080/10635150701397643. [DOI] [PubMed] [Google Scholar]
- Roger AJ, Simpson AG. Evolution: revisiting the root of the eukaryote tree. Curr Biol. 2009;19:R165–R167. doi: 10.1016/j.cub.2008.12.032. [DOI] [PubMed] [Google Scholar]
- Rokas A. The origins of multicellularity and the early history of the genetic toolkit for animal development. Annu Rev Genet. 2008;42:235–251. doi: 10.1146/annurev.genet.42.110807.091513. [DOI] [PubMed] [Google Scholar]
- Roure B, Rodriguez-Ezpeleta N, Philippe H. SCaFoS: a tool for selection, concatenation and fusion of sequences for phylogenomics. BMC Evol Biol. 2007;7(Suppl 1):S2. doi: 10.1186/1471-2148-7-S1-S2. [DOI] [PMC free article] [PubMed] [Google Scholar]
- Ruiz-Trillo I, Burger G, Holland PW, King N, Lang BF, Roger AJ, Gray MW. The origins of multicellularity: a multi-taxon genome initiative. Trends Genet. 2007;23:113–118. doi: 10.1016/j.tig.2007.01.005. [DOI] [PubMed] [Google Scholar]
- Ruiz-Trillo I, Inagaki Y, Davis LA, Sperstad S, Landfald B, Roger AJ. Capsaspora owczarzaki is an independent opisthokont lineage. Curr Biol. 2004;14:R946–R947. doi: 10.1016/j.cub.2004.10.037. [DOI] [PubMed] [Google Scholar]
- Ruiz-Trillo I, Lane CE, Archibald JM, Roger AJ. Insights into the evolutionary origin and genome architecture of the unicellular opisthokonts Capsaspora owczarzaki and Sphaeroforma arctica. J Eukaryot Microbiol. 2006;53:379–384. doi: 10.1111/j.1550-7408.2006.00118.x. [DOI] [PubMed] [Google Scholar]
- Ruiz-Trillo I, Riutort M, Littlewood DT, Herniou EA, Baguna J. Acoel flatworms: earliest extant bilaterian Metazoans, not members of Platyhelminthes. Science. 1999;283:1919–1923. doi: 10.1126/science.283.5409.1919. [DOI] [PubMed] [Google Scholar]
- Ruiz-Trillo I, Roger AJ, Burger G, Gray MW, Lang BF. A phylogenomic investigation into the origin of metazoa. Mol Biol Evol. 2008;25:664–672. doi: 10.1093/molbev/msn006. [DOI] [PubMed] [Google Scholar]
- Ryan JF, Pang K, Mullikin JC, Martindale MQ, Baxevanis AD. The homeodomain complement of the ctenophore Mnemiopsis leidyi suggests that Ctenophora and Porifera diverged prior to the ParaHoxozoa. Evodevo. 2010;1:9. doi: 10.1186/2041-9139-1-9. [DOI] [PMC free article] [PubMed] [Google Scholar]
- Sanderson MJ, McMahon MM, Steel M. Phylogenomics with incomplete taxon coverage: the limits to inference. BMC Evol Biol. 2010;10:155. doi: 10.1186/1471-2148-10-155. [DOI] [PMC free article] [PubMed] [Google Scholar]
- Schierwater B, Eitel M, Jakob W, Osigus HJ, Hadrys H, Dellaporta SL, Kolokotronis SO, DeSalle R. Concatenated analysis sheds light on early metazoan evolution and fuels a modern “urmetazoon” hypothesis. PLoS Biol. 2009;7:e20. doi: 10.1371/journal.pbio.1000020. [DOI] [PMC free article] [PubMed] [Google Scholar]
- Schierwater B, Kamm K, Srivastava M, Rokhsar D, Rosengarten RD, Dellaporta SL. The early ANTP gene repertoire: insights from the placozoan genome. PLoS One. 2008;3:e2457. doi: 10.1371/journal.pone.0002457. [DOI] [PMC free article] [PubMed] [Google Scholar]
- Schmidt HA, Strimmer K, Vingron M, von Haeseler A. TREE-PUZZLE: maximum likelihood phylogenetic analysis using quartets and parallel computing. Bioinformatics. 2002;18:502–504. doi: 10.1093/bioinformatics/18.3.502. [DOI] [PubMed] [Google Scholar]
- Sebé-Pedrós A, de Mendoza A, Lang BF, Degnan BM, Ruiz-Trillo I. Unexpected repertoire of metazoan transcription factors in the unicellular holozoan Capsaspora owczarzaki. Mol Biol Evol. 2010;28:1241–1254. doi: 10.1093/molbev/msq309. [DOI] [PMC free article] [PubMed] [Google Scholar]
- Sebé-Pedrós A, Roger AJ, Lang FB, King N, Ruiz-Trillo I. Ancient origin of the integrin-mediated adhesion and signaling machinery. Proc Natl Acad Sci U S A. 2010;107:10142–10147. doi: 10.1073/pnas.1002257107. [DOI] [PMC free article] [PubMed] [Google Scholar]
- Sebé-Pedrós A, Ruiz-Trillo I. Integrin-mediated adhesion complex: cooption of signaling systems at the dawn of Metazoa. Commun Integr Biol. 2010;3:475–477. doi: 10.4161/cib.3.5.12603. [DOI] [PMC free article] [PubMed] [Google Scholar]
- Shalchian-Tabrizi K, Minge MA, Espelund M, Orr R, Ruden T, Jakobsen KS, Cavalier-Smith T. Multigene phylogeny of choanozoa and the origin of animals. PLoS One. 2008;3:e2098. doi: 10.1371/journal.pone.0002098. [DOI] [PMC free article] [PubMed] [Google Scholar]
- Shimodaira H. An approximately unbiased test of phylogenetic tree selection. Syst Biol. 2002;51:492–508. doi: 10.1080/10635150290069913. [DOI] [PubMed] [Google Scholar]
- Shimodaira H, Hasegawa M. CONSEL: for assessing the confidence of phylogenetic tree selection. Bioinformatics. 2001;17:1246–1247. doi: 10.1093/bioinformatics/17.12.1246. [DOI] [PubMed] [Google Scholar]
- Srivastava M, Begovic E, Chapman J, et al. The Trichoplax genome and the nature of placozoans. Nature. (21 co-authors). 2008;454:955–960. doi: 10.1038/nature07191. [DOI] [PubMed] [Google Scholar]
- Stamatakis A. RAxML-VI-HPC: maximum likelihood-based phylogenetic analyzes with thousands of taxa and mixed models. Bioinformatics. 2006;22:2688–2690. doi: 10.1093/bioinformatics/btl446. [DOI] [PubMed] [Google Scholar]
- Stamatakis A, Auch AF, Meier-Kolthoff J, Göker M. AxPcoords & parallel AxParafit: statistical co-phylogenetic analyzes on thousands of taxa. BMC Bioinformatics. 2007;8:405. doi: 10.1186/1471-2105-8-405. [DOI] [PMC free article] [PubMed] [Google Scholar]
- Stanke M, Keller O, Gunduz I, Hayes A, Waack S, Morgenstern B. AUGUSTUS: ab initio prediction of alternative transcripts. Nucleic Acids Res. 2006;34:W435–W439. doi: 10.1093/nar/gkl200. [DOI] [PMC free article] [PubMed] [Google Scholar]
- Steenkamp ET, Wright J, Baldauf SL. The protistan origins of animals and fungi. Mol Biol Evol. 2006;23:93–106. doi: 10.1093/molbev/msj011. [DOI] [PubMed] [Google Scholar]
- Strimmer K, von Haeseler A. Quartet puzzling: a quartet maximum-likelihood method for reconstructing tree topologies. Mol Biol Evol. 1996;13:964–969. [Google Scholar]
- Susko E, Spencer M, Roger AJ. Biases in phylogenetic estimation can be caused by random sequence segments. J Mol Evol. 2005;61:351–359. doi: 10.1007/s00239-004-0352-9. [DOI] [PubMed] [Google Scholar]
- Wheeler WC. Nucleic acid sequence phylogeny and random outgroups. Cladistics. 1990;6:363–367. doi: 10.1111/j.1096-0031.1990.tb00550.x. [DOI] [PubMed] [Google Scholar]
- Whelan S, Goldman N. A general empirical model of protein evolution derived from multiple protein families using a maximum-likelihood approach. Mol Biol Evol. 2001;18:691–699. doi: 10.1093/oxfordjournals.molbev.a003851. [DOI] [PubMed] [Google Scholar]
- Woese CR, Achenbach L, Rouviere P, Mandelco L. Archaeal phylogeny: reexamination of the phylogenetic position of Archaeoglobus fulgidus in light of certain composition-induced artifacts. Syst Appl Microbiol. 1991;14:364–371. doi: 10.1016/s0723-2020(11)80311-5. [DOI] [PubMed] [Google Scholar]
- Yang S, Bourne PE. The evolutionary history of protein domains viewed by species phylogeny. PLoS One. 2009;4:e8378. doi: 10.1371/journal.pone.0008378. [DOI] [PMC free article] [PubMed] [Google Scholar]
- Yang S, Doolittle RF, Bourne PE. Phylogeny determined by protein domain content. Proc Natl Acad Sci U S A. 2005;102:373–378. doi: 10.1073/pnas.0408810102. [DOI] [PMC free article] [PubMed] [Google Scholar]
- Yeh RF, Lim LP, Burge CB. Computational inference of homologous gene structures in the human genome. Genome Res. 2001;11:803–816. doi: 10.1101/gr.175701. [DOI] [PMC free article] [PubMed] [Google Scholar]
Associated Data
This section collects any data citations, data availability statements, or supplementary materials included in this article.