
07792 152189
All-In-One Sales & Marketing Platform
We Help Landscapers Thrive
Automate Your Lead Generation, Followup, & Project Acquisition Today

4.9/5 star reviews
See why we have such raving reviews
AS SEEN ON


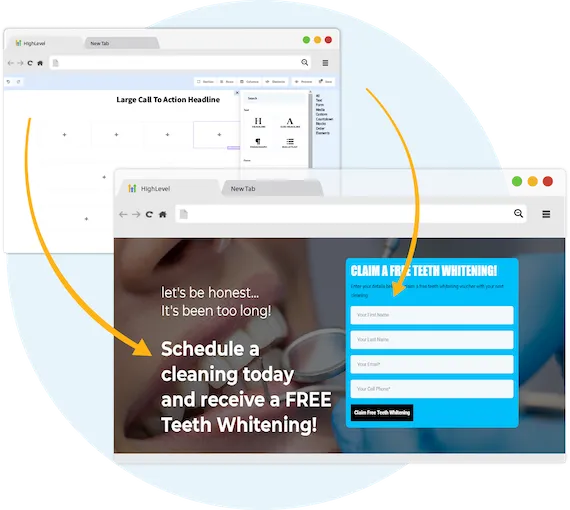
🚀 Full High Converting Website
Effortlessly launch a website in 5 minutes that converts more of your "website visitors" into booked appointments.

⚡ Automated Lead Followup
No more missed leads! Automatically text & email your leads as soon as they come in. Speed to lead is everything. No need for an office manager to "remember" to call back.

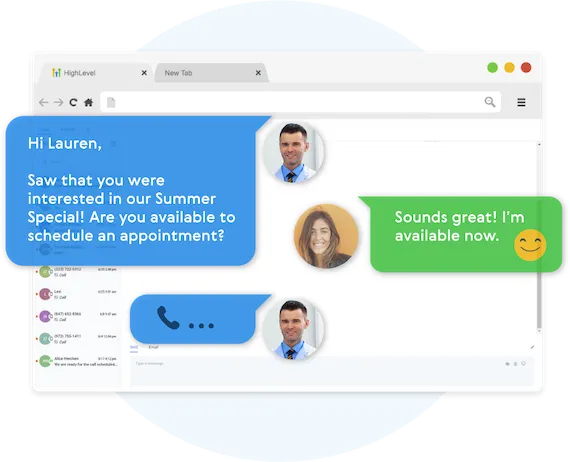
📮 Full Transparent Conversation System
Manage all your online leads from all platforms, Facebook, Instagram, your website, google, all in one place. No need to log into 100 different softwares.
🧠 100 + Directory Listings
List your business of 100+ directories with 1 click including Yelp, Bing, Apple Maps, Yahoo etc. All to help rank you higher on Google PLUS customers can find you everywhere online!
💯 Boost Your Online Reviews
Never forget to ask for a review again with our auto revire funnel. Elevate your companies reputation with more Google and Facebook reviews, which helps drive more business & appear higher on the google searches.
📬 Book More Appointments Using Calendars
Leads are simply not enough... We'll install a calendar into your online sales process, so prospects can book a "phone call consultation" with your company, so you can wave goodbye to playing phone tag.
The Difference
Agencies Vs. Our Solution
Lengthy contracts: 3-4 months..
Zero trial period.
Expensive: £2,000+/month.
Lead generation solution.
Get You More "Leads"
No contracts.
7-day free trial.
Affordable: £197/month.
Appointment generation solution.
Grow your online presence
Business Maker Online
Has everything Your Landscaping Company
Needs To Succeed
1. Generate Leads & Automatically Followup
Many times sales leads fall through the cracks when the day gets hectic. Automate your lead followup & schedule SMS messages to send out periodically to interested prospects.
2. Automated Appointment & Estimate Reminders
How many times have you scheduled a phone call or sales meeting & wish either you or your clients received a reminder so that everyone shows up on time. We make that possible.
3. Manage All Social Media & Online Presence In One Place
There are thousands of online profiles, which makes it impossible to manage everything yourself. By creating an account, you can have everything managed in one location without the need of an external company.
Capture New Leads
Business Maker Online is a Full Suite Platform for landscaping companies. Whether you're running Facebook, Google, or using a 3rd party lead generator, we help you generate & convert more leads into customers.
MANAGE FULL WEBSITES, FUNNELS & LANDING PAGES
Our intuitive platform allows you to create full-featured high converting landing pages & funnels, or we can integrate with your existing website.
TRACK EVERY SALE DIRECTLY FROM ITS SOURCE
Built right in is the ability to capture leads through Surveys and capture forms. You'll know exactly where each lead and customer came from.
ONLINE APPOINTMENT SCHEDULING
We've built our own calendar application within Business Maker Online, so you can capture all sales and company appointments in one place with automated reminders and followup
Never Lose Another Lead Again
Automatically Nurture Existing Leads Into Customers.
EASILY CUSTOMIZE YOUR FOLLOW-UP CAMPAIGNS
Our Multi-channel follow up campaigns allow you to automate engaging follow ups and capture all responses from your leads, across all channels.
CREATE MULTI-CHANNEL CAMPAIGNS
Business Maker Online allows you to connect with your leads through Phone, Voicemail Drops, SMS/MMS, Emails, GMB Messages, and even Facebook Messenger.
TWO-WAY COMMUNICATION ON ANY DEVICE
Our full featured mobile app allows you to communicate with your leads on all devices.
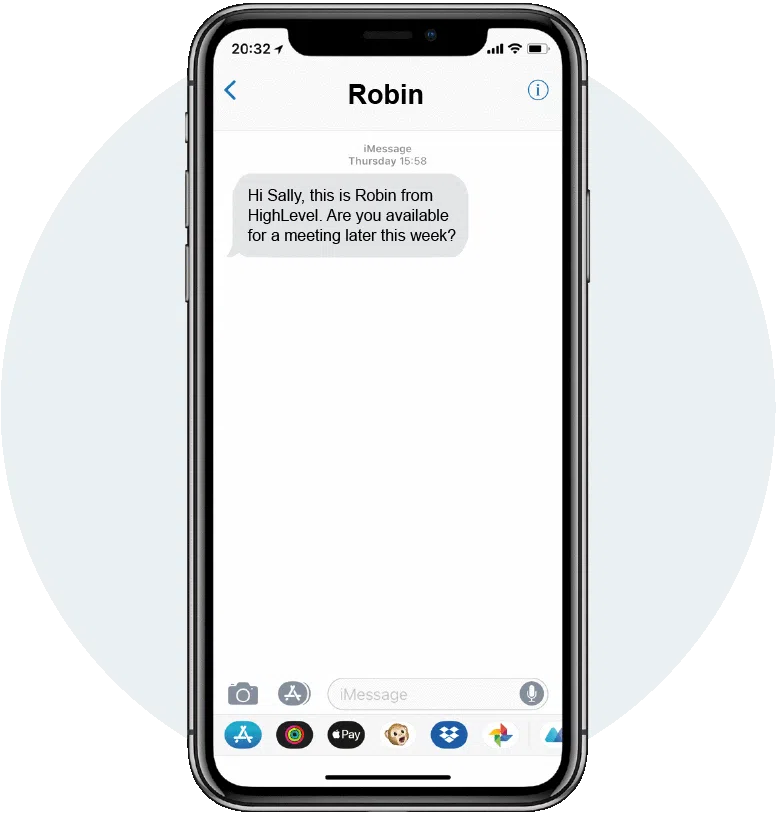
Fully Automated Booking
Automatically book leads and prospects on your calendar without lifting a finger.
AUTOMATED NURTURE CONVERSATIONS
Create text conversations with the goal of placing booked appointments on calendars WITHOUT any human interaction if you so choose.
FULL CUSTOMIZATION OF MESSAGING
Use our campaign builder to customize the messaging.
ARTIFICIAL INTELLIGENCE BUILT IN
Business Maker Online allows you to leverage AI (Artificial Intelligence) and Machine Learning to manage the conversation.
TESTIMONIALS
Testimonials ipsum dolor

"Testimomnial lorem ipsum dolor sit amet, consectetur adipisicing elit. Autem dolore, alias, numquam enim dolor elit."
- Best name ever

"Testimomnial lorem ipsum dolor sit amet, consectetur adipisicing elit. Autem dolore, alias, numquam enim dolor elit."
- Name ipsum

"Testimomnial lorem ipsum dolor sit amet, consectetur adipisicing elit. Autem dolore, alias, numquam enim dolor elit."
- Name ipsum

"Testimomnial lorem ipsum dolor sit amet, consectetur adipisicing elit. Autem dolore, alias, numquam enim dolor elit."
- Name ipsum

ABOUT US
Meet Steve
Introduction ipsum dolor sit amet, consectetur adipisicing elit. Autem dolore, alias, numquam enim ab voluptate id quam harum ducimus cupiditate similique quisquam et deserunt.
Epiphany ipsum dolor sit amet, consectetur adipisicing elit. Autem dolore, alias, numquam enim ab voluptate id quam harum.
Results ipsum dolor sit amet:
Credibility lorem authority ipsum
Achievement lorem experience ipsum
Credibility lorem authority ipsum
Achievement lorem experience ipsum
Credibility lorem authority ipsum
WHO IS THIS FOR
We Serve The Following Industries
Kitchen Remodeling
Bathroom Remodeling
Garage Remodeling
Roofing
THIS PERSON
THIS PERSON
THIS PERSON
THIS PERSON
THIS PERSON
THIS PERSON
THIS PERSON
THIS PERSON
STILL NOT SURE?
Satisfaction Guaranteed
We are committed to ensuring your complete satisfaction with our services. If, for any reason, you find yourself not fully satisfied with the results we deliver, please reach out to us. We are dedicated to resolving your concerns promptly and effectively, offering solutions such as additional support, service modifications, or other measures tailored to meet your specific needs. Our goal is to ensure that your experience with us not only meets but exceeds your expectations, reinforcing our commitment to excellence in serving your business needs.

Free 7 Day Trial
Create your free account and try it for yourself to see how you like it!
Copyrights 2023 | Business Maker Online™ | Terms & Conditions