
Abstract
Minimally invasive biomarkers are urgently needed to detect molecular pathology in frontotemporal dementia (FTD) and amyotrophic lateral sclerosis (ALS). Here, we show that plasma extracellular vesicles (EVs) contain quantifiable amounts of TDP-43 and full-length tau, which allow the quantification of 3-repeat (3R) and 4-repeat (4R) tau isoforms. Plasma EV TDP-43 levels and EV 3R/4R tau ratios were determined in a cohort of 704 patients, including 37 genetically and 31 neuropathologically proven cases. Diagnostic groups comprised patients with TDP-43 proteinopathy ALS, 4R tauopathy progressive supranuclear palsy, behavior variant FTD (bvFTD) as a group with either tau or TDP-43 pathology, and healthy controls. EV tau ratios were low in progressive supranuclear palsy and high in bvFTD with tau pathology. EV TDP-43 levels were high in ALS and in bvFTD with TDP-43 pathology. Both markers discriminated between the diagnostic groups with area under the curve values >0.9, and between TDP-43 and tau pathology in bvFTD. Both markers strongly correlated with neurodegeneration, and clinical and neuropsychological markers of disease severity. Findings were replicated in an independent validation cohort of 292 patients including 34 genetically confirmed cases. Taken together, the combination of EV TDP-43 levels and EV 3R/4R tau ratios may aid the molecular diagnosis of FTD, FTD spectrum disorders and ALS, providing a potential biomarker to monitor disease progression and target engagement in clinical trials.
Main
FTD encompasses different neurodegenerative disorders, including bvFTD, semantic variant primary progressive aphasia (svPPA) and nonfluent variant primary progressive aphasia. FTD, progressive supranuclear palsy (PSP), corticobasal degeneration (CBD) and ALS are part of a disease continuum with overlapping symptoms, genetics and molecular pathology1. Although ALS, FTD–ALS and roughly half of bvFTD cases are characterized by intracellular protein inclusions of TAR DNA-binding protein (TDP-43)2, PSP, CBD and approximately 40% of bvFTD cases have been linked to tau pathology at autopsy (frontotemporal lobar degeneration, FTLD-tau)3. Together, FTLD-tau and FTLD-TDP-43 account for nearly 90% of bvFTD cases. The microtubule-binding protein exists in six different isoforms caused by alternative splicing4. Based on the presence of three or four repetitive protein domains, so-called repeats, 3-repeat or 4-repeat isoforms are distinguished (3R, 4R tau). FTLD-tau can be characterized by the predominance of 3R tau aggregates (Pick’s disease) or 4R tau pathology PSP, CBD, argyrophilic grain disease or globular glial tauopathy (GGT)5.
So far, disease-modifying therapies are not available for FTD and ALS spectrum disorders. This is partially caused by the lack of biomarkers detecting the molecular pathology, which is a prerequisite for patient stratification in sporadic bvFTD. Currently, diagnosis of molecular pathology is only possible postmortem, with the exception of genetic cases in which a pathogenic mutation allows ante-mortem deduction of the associated molecular pathology. A diagnostic biomarker may further help in cases of diagnostic uncertainty and could facilitate early diagnosis, which is important because disease-modifying, novel therapies are expected to be more successful in the early disease stages when irreversible neuron loss is less progressed. Delayed and incorrect diagnoses have been reported for a substantial proportion of patients with ALS6, PSP7 and bvFTD8. Therefore, pathology-specific biomarkers are urgently needed.
Plasma glial fibrillary acidic protein/neurofilament light chain (NfL) ratios have been suggested to distinguish FTLD-tau from TDP-43 (ref. 9). Other studies have investigated TDP-43, phosphorylated or aggregated TDP-43 in blood or cerebrospinal fluid (CSF)10,11,12,13,14, CSF p-tau181/tau ratio15 or CSF peptides encoded by cryptic exons as markers of TDP-43 pathology16, albeit with conflicting results. CSF tau isoforms have been proposed as diagnostic markers for 3R or 4R predominant tauopathies17, but detection is hampered by tau fragmentation in extracellular fluids18 resulting in extremely low concentrations of full-length tau. We recently published a CSF assay employing immunoprecipitation followed by mass spectrometry that could overcome this obstacle19. However, because of the invasiveness of lumbar puncture, we turned to blood, more specifically to plasma EVs.
EVs contribute to intercellular communication or serve to clear toxic cellular content20. They can transport pathological tau21,22,23,24 and TDP-43 (ref. 25) species between cells and induce aggregate formation in target cells. Importantly, the presence of TDP-43 in EVs could reflect its disease-associated mislocalization from the nucleus to the cytosol, because extranuclear localization of TDP-43 is a prerequisite for its sorting into EVs.
Here, we show that plasma EVs contain substantial amounts of unfragmented tau. This allows the measurement of 3R and 4R tau isoform ratios, which has not been possible from blood, so far. We quantified the plasma EV 3R/4R tau ratio and TDP-43 in a large neurodegenerative disease cohort (DESCRIBE cohort) to test the hypothesis that a combination of both markers may distinguish FTLD-tau from FTLD-TDP-43 pathology. As diagnostic groups we selected bvFTD, which is largely associated with either FTLD-tau or FTLD-TDP-43 pathology, PSP based on its association with 4R tau pathology, Alzheimer disease (AD) as a secondary tauopathy with equally balanced 3R and 4R tau pathology, and svPPA and ALS as disorders with almost exclusive TDP-43 pathology, in addition to healthy controls (HC). Our cohort included 68 genetically and/or neuropathologically proven cases. Findings were validated in a second, independent cohort (Sant Pau cohort), comprising 287 participants with ALS, ALS–FTD, bvFTD, PSP and HC, including 34 genetically confirmed cases (Extended Data Fig. 1).
Intriguingly, we find that the combination of plasma EV 3R/4R tau ratio together with plasma EV TDP-43 allows the distinction of FTLD-tau from FTLD-TDP-43 in FTD and the detection of ALS-TDP-43 in ALS. Furthermore, the plasma EV 3R/4R tau ratio can serve as a biomarker to distinguish 4R tauopathy PSP from other FTD spectrum disorders and from HC.
Results
Detection of full-length tau in CSF and plasma EVs
We prepared medium-sized CSF and plasma EVs (mEVs) after sequential centrifugation from the 10,000g centrifugation pellet26. Small EVs (sEVs) were isolated from the 10,000g supernatant by size-exclusion chromatography as previously described26 (Supplementary Data and Supplementary Fig. 1c,d). Mass spectrometry revealed full-length tau in CSF and plasma EVs, allowing the distinction of 3R and 4R isoforms (Supplementary Data and Supplementary Fig. 2). Because venous puncture is less invasive than lumbar puncture, we decided to assess 3R and 4R tau isoform concentrations in plasma EVs, using sandwich immunoassays (Methods, Supplementary Fig. 3a–e and Supplementary Table 1).
To test whether plasma EV tau stems from brain or peripheral nerve cells27, thrombocytes28 or lymphocytes29, we immunoisolated anti-L1 cell adhesion molecule-positive EVs (L1CAM EVs) from plasma EV preparations. L1CAM EVs are considered brain–neuron derived, although this notion is controversial30. As shown in Supplementary Fig. 4, the vast majority of plasma EV tau resided in L1CAM EVs.
Plasma EV 3R/4R tau ratio is low in PSP and high in bvFTD
We performed a pilot study on plasma EV 3R and 4R tau content in a subcohort of the DZNE multicenter DESCRIBE cohort (subcohort 1) (Extended Data Table 1 and Extended Data Fig. 1).
The plasma EV 3R/4R tau ratio did not correlate with age, sex and disease duration (Supplementary Table 2). HC, AD and svPPA groups showed plasma sEV 3/4R tau ratios of ~1, consistent with the balanced ratios of 3R and 4R tau described in physiological conditions and in AD tau aggregates31 (HC median 1.16, interquartile range (IQR) [0.99–1.28]; AD median 0.91, IQR [0.57–1.25]; svPPA median 1.00, IQR [0.98–1.11]) (Fig. 1a). sEV 3R/4R tau ratios were lower in the 4R tauopathy PSP (median 0.18, IQR [0.13–0.29]; P < 0.0001 for all comparisons), and higher in bvFTD compared with all other groups (bvFTD median 2.59, IQR [2.02–3.87], P < 0.001 versus HC; P < 0.0001 versus all other groups). Individual bvFTD values overlapped partially with HC, svPPA and groups. Receiver operating characteristic (ROC) curve analysis revealed high diagnostic accuracies for the distinction of PSP (Fig. 1b–e) and bvFTD (Fig. 1f–h) from all other groups (AUC PSP versus HC 0.96, 95% confidence interval (CI) [0.83–0.98]; PSP versus AD 0.99, CI [0.90–1.00]; PSP versus svPPA 0.96, CI [0.90–0.98]; PSP versus bvFTD 0.99, CI [0.94–1.00]; bvFTD versus HC 0.93, CI [0.88–1.00]; bvFTD versus AD 0.90, CI [0.90–1.00]; bvFTD versus svPPA 0.95, CI [0.90–0.98]) (Supplementary Table 3).

a, The long horizontal line represents the median and the short horizontal lines represent the IQR. Kruskal–Wallis test with Dunn’s correction for multiple comparisons. (HC versus bvFTD P = 0.0003, HC versus PSP P = 0.0000044, AD versus bvFTD P = 0.0003, AD versus PSP P = 0.0000052, svPPA versus bvFTD P = 0.0007, svPPA versus PSP P = 0.0000057, bvFTD versus PSP P = 0.0000019; *P < 0.05, **P < 0.001, ***P < 0.0001, ****P < 0.00001. Biologically independent samples: HC n = 15, AD n = 23, svPPA n = 17, bvFTD n = 42, PSP n = 44. b–h, ROC curve for sEV 3R/4R tau ratio in PSP versus HC (b), PSP versus AD (c), PSP versus svPPA (d), PSP versus bvFTD (e), bvFTD versus HC (f), bvFTD versus AD (g) and bvFTD versus svPPA (h). i,j, Two-tailed Spearman correlation analysis of associations and monotonic regression splines between sEV 3R/4R ratio and plasma NfL levels within PSP (i) and bvFTD (j) (P = 0.00009) diagnostic groups. k–n, Correlation matrix depicting results of two-tailed Spearman correlations, visualized by plotting strength of correlation (r) as a heat map along with P values (right): PSP (k,l) and bvFTD (m,n). PSP: MoCA34, PSP-RS35, PSP-CDS36, SEADL37, CGI-s38; PSP-SS35, MDS-UPDRS Part III39, SAS40 and the PSP-QoL41 (Supplementary Fig. 7a,b and Supplementary Table 5). bvFTD: MMSE33, MoCa, FAQ42, CDR-SB43, CDR plus NACC FTLD, previously termed CDR-SB FTD44, NPI-Q45 and CBI-M46.
Plasma sEV 3R/4R tau ratios correlated positively (r = 0.68, P < 0.0001) with plasma NfL levels in bvFTD, and negatively in the 4R tauopathy PSP (Fig. 1i,j (sEV r = −0.48, P = 0.001)). High plasma EV 3R/4R tau ratios in bvFTD corresponded to more severe clinical and cognitive impairment, as did low ratios in PSP, consistent with 4R tau predominance in PSP (Fig. 1k–n, Supplementary Fig. 5 and Supplementary Tables 4 and 5).
We next tested for a potential correlation of 3R/4R tau ratios between CSF and plasma sEV (Supplementary Fig. 6). However, low sample numbers and the need for larger CSF sample volumes prevent a clear conclusion on whether CSF and plasma sEV 3R and 4R tau correlate with each other (Supplementary Table 6).
We validated our findings in additionally available samples of the DZNE DESCRIBE cohort (subcohort 2: 56 HC, 165 ALS, 179 bvFTD and 163 PSP samples). Patient demographics are given in Extended Data Table 2. ALS was chosen as a TDP-43 control group because the vast majority of ALS cases are associated with TDP-43 pathology32. Plasma sEV 3R/4R tau ratios were lowest in PSP (median sEV: 3R/4R tau 0.45, IQR [0.34–0.60]) and differed from all other diagnostic groups (median sEV: HC 0.99, IQR [0.91–1.03], PSP versus HC P < 0.0001; ALS 0.95, IQR [0.88–1.01], PSP versus ALS P < 0.0001; bvFTD 1.10, IQR [0.99–1.76], PSP versus bvFTD P < 0.0001) (Fig. 2a). ROC analysis (Fig. 2b–d), revealed high accuracy for the distinction of PSP from HC (AUC 0.98, CI [0.96–1.00]), ALS (AUC 0.96, CI [0.94–0.99]) and bvFTD (AUC 0.98, CI [0.73–1.00]) (Supplementary Table 3 (sEV) and Supplementary Fig. 7a–d and Supplementary Table 3 (mEV)).

a, Horizontal lines indicate median and IQR. Kruskal–Wallis test with Dunn’s correction for multiple comparisons. HC versus bvFTD P = 0.0000057, HC versus PSP P = 0.000009, ALS versus bvFTD P = 0.0000074, ALS versus PSP P = 0.0000023, bvFTD versus PSP P = 0.0000067; ****P < 0.00001. Biologically independent samples: HC n = 56, ALS n = 165, bvFTD n = 179, PSP n = 163. b–f, ROC curve for plasma sEV 3R/4R tau ratio: PSP versus HC (b), PSP versus ALS (c), PSP versus bvFTD (d), bvFTD versus HC (e) and bvFTD versus ALS (f). g–j, Correlation matrix depicting the results of two-sided Spearman correlations, visualized by plotting strength of correlation (r) as a heat map along with P values (right): PSP (g,h) and bvFTD (i,j). k,l, 3R/4R tau ratio in plasma-derived sEV in genetically (n = 37) or autopsy-confirmed (n = 31) cases from DESCRIBE subcohort 2 (total number of individual cases n = 63, 5 of these cases had both genetic and neuropathological diagnosis). k, sEV 3R/4R tau ratios in the different pathology groups, stratified by clinical diagnosis. HC versus bvFTD P = 0.0000052, HC versus PSP P = 0.0000012, ALS versus bvFTD P = 0.0000097, ALS versus PSP P = 0.0000056, bvFTD versus PSP P = 0.0000041; ****P < 0.00001. l, sEV 3R/4R tau ratios of the different pathology groups, independent of clinical diagnostic group. The long horizontal line represents the median and the short horizontal lines represent the IQR. Kruskal–Wallis test with Dunn’s correction for multiple comparisons. HC versus tau (PSP/GGT)-type P = 0.000007, HC versus MAPT mutations P = 0.0000063, tau(PSP/GGT)-type versus MAPT mutations P = 0.000004, tau(PSP/GGT)-type versus non-tau/non-TDP-43 P = 0.0000078, MAPT mutations versus non-tau/non-TDP-43 P = 0.0000041; ****P < 0.00001. TDP-43 pathology group: bvFTD (C9orf72 (n = 13), GRN (n = 4), VCP (n = 4), TBK-1 (n = 2)); ALS (C9orf72 (n = 5)); neuropathological diagnosis (FTLD-TDP (n = 1)); ALS-TDP (n = 17), ALS-FTLD-TDP (n = 6)). PSP/GGT-type tau pathology group: neuropathological diagnosis ((PSP-tau (n = 3); FTLD-tau GGT-type (n = 1)). bvFTD MAPT mutations (MAPT P301L (n = 1), MAPT P364S (n = 1), MAPT IVS10+16C>T (n = 1)). Non-tau/non-TDP-43 pathology group: ALS (SOD-1 (n = 2); FUS (n = 2); CHCHD10 (n = 1)); bvFTD (CHCHD10 (n = 1)).
Increased EV 3R/4R tau ratios were detected in bvFTD. Approximately 50% (54.19%) of bvFTD values were above the control group median, suggesting tau pathology in these cases (median sEV 3R/4R tau in bvFTD 2.28, IQR [1.13–2.4]; median mEV 3R/4R tau in bvFTD 1.84, IQR [1.19–2.13]; bvFTD versus all other diagnostic groups P < 0.0001 (median sEV); bvFTD versus all other diagnostic groups P < 0.0001 (median mEV)). Plasma EV 3R/4R tau ratios distinguished bvFTD from HC, ALS and PSP with high diagnostic accuracy (sEVs AUC 0.89–0.98 (Fig. 2d–f) and mEVs AUC 0.86–0.97 (Supplementary Fig. 7d,f); Supplementary Table 3). As in subcohort 1, EV tau ratios were not correlated with age, sex and disease duration (Supplementary Table 7).
Plasma EV 3R/4R tau ratios correlate with disease severity
Similar to subcohort 1, plasma EV 3R/4R tau ratios correlated with plasma NfL in bvFTD (r = 0.28, P < 0.0001 (sEV) and r = 0.36, P = 0.002 (mEV)) and inversely in PSP (r = −0.33, P < 0.0001 (sEV) and r = −0.24, P = 0.005 (mEV)) (Extended Data Fig. 2a,b and Supplementary Fig. 7g,h).
Plasma EV 3R/4R tau ratios correlated with clinical, neurological and cognitive measures of disease severity in the PSP group, with low plasma ratios indicative of increased severity (PSP: Mini Mental State Examination (MMSE)33, Montreal Cognitive Assessment (MoCA)34, PSP rating scale (PSP-RS)35, PSP clinical deficits scale (PSP-CDS)36, Schwab and England disability scale (SEADL)37, Clinical Global Impression Severity Scale (CGI-s)38 (Fig. 2g,h and Supplementary Table 8 (sEV) and Supplementary Fig. 8i,j and Supplementary Table 8 (mEV)), PSP staging system (PSP-SS)35, MDS-Unified Parkinson’s Disability Rating Scale part III (MDS-UPDRS III)39, Starkstein Apathy Scale (SAS)40 and PSP quality of life scale (PSP-QoL)41 (Supplementary Fig. 8a,b and Supplementary Table 8).
In bvFTD, high plasma sEV 3R/4R tau ratios were associated with impaired cognition, compromised functional activities, increased symptom severity and a higher burden of behavior symptoms (MMSE, MoCA, Functional Activities Questionnaire (FAQ)42, Clinical Dementia Rating-Sum of Boxes (CDR-SB)43, Clinical Dementia Rating (CDR) plus National Alzheimer’s Coordinating Center (NACC) Behavior and Language Domains Frontotemporal Lobar Degeneration (NACC FTLD)44, Neuropsychiatric Inventory Questionnaire (NPI-Q)45, and the modified version of the Cambridge Behavior Inventory-Revised Version (CBI-M)46 (Fig. 2i,j and Supplementary Table 9)). Similar results were observed for mEVs (Supplementary Fig. 7k,l and Supplementary Table 9).
Plasma EV tau ratios in pathology-confirmed cases
We stratified cases with known mutations (n = 37) or neuropathologically confirmed diagnoses (n = 31) into TDP-43, tau and non-TDP-43/non-tau pathology groups (number of individual cases n = 63, 5 of these had both genetic and neuropathological diagnosis) (Supplementary Tables 10 and 11). Most mutations were linked to TDP-43 pathology (18 C9orf72, 4 GRN, 4 VCP and 2 TBK1), with the exception of three MAPT mutations (MAPT P301L, MAPT P364S and MAPT IVS10+16C>T) in bvFTD.
Neuropathological diagnoses of nongenetic cases included 22 with TDP-43 (16 ALS-TDP, 6 FTLD-TDP) and 4 with tau pathology (3 PSP-type, 1 GGT-type). All genetic and neuropathologically confirmed cases with TDP-43 pathology were combined into a ‘TDP-43 pathology’ group (n = 50) and all with tau pathology into the ‘tau pathology’ group (n = 7). Cases with neither TDP-43 nor tau pathology (2 SOD1, 2 FUS and 2 CHCHD10 mutation carriers) were classified as ‘non-TDP-43/non-tau pathology’ (n = 6).
In the TDP-43 pathology group, and in the non-TDP-43/non-tau pathology group, sEV 3R/4R tau ratios were ~1 and did not differ from the HC group (HC: median sEV 0.99, IQR [0.91–1.03]; TDP-43 group: median sEV 0.95, IQR [0.92–0.97], versus HC P > 0.05; non-TDP-43/non-tau group: median sEV 0.96, IQR [0.90–1.03], versus HC P > 0.05) (Fig. 2k,l (mEV) and Supplementary Fig. 9a,b). Importantly, all bvFTD TDP-43 pathology cases were in the lower range, comparable with HC, and ALS PSP/GGT-type 4R tau pathology cases were characterized by decreased plasma EV 3R/4R tau levels (median sEV 0.42, IQR [0.35–0.60]) compared with HC (median sEV 0.99, IQR [0.91–1.03], P < 0.00001), with TDP-43 pathology (median sEV 0.95, IQR [0.92–0.97], P < 0.00001) and with non-TDP43/non-tau pathology groups (median sEV 0.96, IQR [0.90–1.03], P < 0.00001). By contrast, EV 3R/4R tau ratios in MAPT mutation carriers were approximately three to four times higher (median sEV 3.96, IQR [3.81–4.12]) compared with HC, TDP-43 and non-TDP-43/non-tau control groups (P < 0.00001). Thus, EV 3R/4R tau ratios may separate FTLD-tau pathology from FTLD-TDP and detect PSP/GGT-type tau pathology.
Plasma EVs contain TDP-43
Western blotting (Supplementary Fig. 10a) and single-molecule array (SIMOA) assay analysis confirmed the presence of TDP-43 in plasma EVs (for specificity and assay performance see Supplementary Data, Supplementary Fig. 10 and Supplementary Table 1). As illustrated in Supplementary Fig. 4, the majority of plasma EV TDP-43 stems from L1CAM-positive EVs.
Plasma EV TDP-43 is increased in ALS and bvFTD
Plasma sEV TDP-43 levels were highest in ALS (median 45.45 pg ml−1, IQR [28.88−83.21]) compared with HC (9.47 pg ml−1, IQR [7.63−13.33], P < 0.00001), bvFTD (31.25 pg ml−1, IQR [14.45−41.09]) and PSP (9.09 pg ml−1, IQR [7.73−13.27], P < 0.00001) (Fig. 3a (sEV) and Supplementary Fig. 11a and Supplementary Table 3 (mEV)). Plasma sEV TDP-43 distinguished ALS from HC, PSP and bvFTD with AUC values of 0.99, CI [0.97–1.00]; 0.99, CI [0.98–1.00]; and 0.91, CI [0.88–0.94] (Fig. 3b–d). Similar results were obtained for plasma mEV TDP-43 concentrations and AUC values (Supplementary Fig. 11a–d). No correlation was observed with age, sex or disease duration (Supplementary Table 7). Of note, plasma TDP-43 levels did not differ between the diagnostic groups, highlighting the importance of EV analysis (Extended Data Fig. 3).
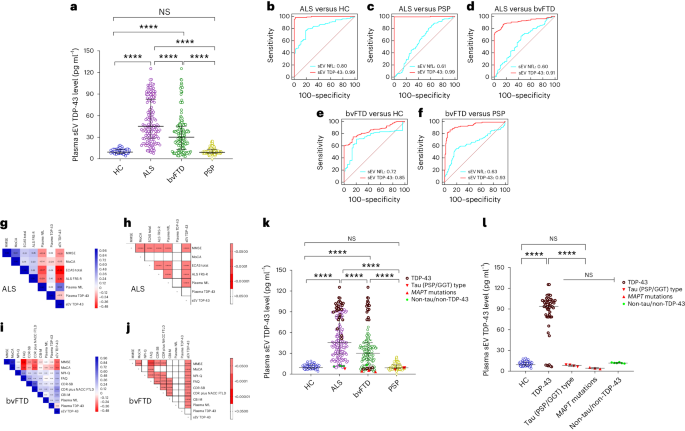
a, The long horizontal line represents the median and the short horizontal lines represent IQR. Kruskal–Wallis test with Dunn’s correction for multiple comparisons. HC versus ALS P = 0.000003, HC versus bvFTD P = 0.000006, ALS versus bvFTD P = 0.0000074, ALS versus PSP P = 0.0000028, bvFTD versus PSP P = 0.0000012; ****P < 0.00001. Biologically independent samples: HC n = 56, ALS n = 165, bvFTD n = 179 and PSP n = 163. b–f, ROC curve for sEV TDP-43 (red) and plasma NfL (blue): ALS versus HC (b), ALS versus PSP (c), ALS versus bvFTD (d), bvFTD versus HC (e) and bvFTD versus PSP (f). g–j, Correlation matrix depicting results of two-sided Spearman correlations, visualized by plotting strength of correlation (r) as a heat map along with P values (right). ALS (g,h) and bvFTD (i,j). TDP-43 in plasma sEV in genetically (n = 37) or autopsy-confirmed (n = 31) cases from the DESCRIBE subcohort 2 (total number of individual cases: n = 63, 5 of which had both genetic and neuropathological diagnoses). k, sEV TDP-43 in the different pathology groups, stratified by clinical diagnosis. HC versus ALS P = 0.000003, HC versus bvFTD P = 0.000006, ALS versus bvFTD P = 0.0000074, ALS versus PSP P = 0.0000028, bvFTD versus PSP P = 0.0000012; ****P < 0.00001. l, sEV TDP-43 concentrations in the different pathology groups, independent of clinical diagnostic group. The long horizontal line represents the median and the short horizontal lines represent the IQR. Kruskal–Wallis test with Dunn’s correction for multiple comparisons. HC versus TDP-43 P = 0.000008, TDP-43 versus tau (PSP/GGT)-type P = 0.000006, TDP-43 versus MAPT mutations P = 0.0000035, TDP-43 versus non-tau/non-TDP-43 P = 0.0000039; ****P < 0.00001. TDP-43 pathology group: bvFTD (C9orf72 (n = 13), GRN (n = 4), VCP (n = 4), TBK1 (n = 2)); ALS (C9orf72 (n = 5)); neuropathological diagnosis (FTLD-TDP (n = 1); ALS-TDP (n = 17), ALS-FTLD-TDP (n = 6)). PSP/GGT-type tau pathology group: neuropathological diagnosis (PSP-tau (n = 3); FTLD-tau GGT-type (n = 1)). bvFTD MAPT mutations: MAPT P301L (n = 1), MAPT P364S (n = 1), MAPT IVS10+16C>T (n = 1). Non-tau/non-TDP-43 pathology group: ALS (SOD-1 (n = 2); FUS (n = 2); CHCHD10 (n = 1)); bvFTD (CHCHD10 (n = 1)).
In bvFTD, plasma EV TDP-43 levels partially overlapped with HC and PSP (low levels) and the ALS group (high levels), suggesting that high levels could indicate TDP-43 pathology in bvFTD. Plasma sEV TDP-43 distinguished bvFTD from HC, PSP and ALS (AUC: bvFTD versus HC 0.85, CI [0.82–0.90]; versus PSP 0.93, CI [0.86–0.89]; versus ALS 0.91, CI [0.0.88–0.94]) (Fig. 3d–f (sEV) and Supplementary Fig. 11d–f (mEV)). Of note, plasma EV TDP-43-based AUC values exceeded plasma NfL-based AUC values (plasma NfL: ALS versus HC 0.83, CI [0.77–0.88]; versus PSP 0.62, CI [0.56–0.67]; versus bvFTD 0.61, CI [055–0.66]; bvFTD versus HC 0.73, CI [0.71–0.75]; versus PSP 0.63, CI [0.61–0.71]; P < 0.0001 for all comparisons) (Fig. 3b–f (sEV), Supplementary Fig. 11b–f and Supplementary Table 3 (mEV)).
Plasma EV TDP-43 correlates with disease severity
Plasma EV TDP-43 levels were highly correlated with plasma NfL concentrations in ALS and bvFTD (ALS sEV: r = 0.67, P < 0.0001; bvFTD sEV: r = 0.42, P < 0.0001; Extended Data Fig. 2c,d (sEV) and Supplementary Fig. 11g,h (mEV)). In ALS, higher plasma EV TDP-43 levels were associated with worse cognitive performance and disease severity (MMSE, Edinburgh Cognitive and Behavioral ALS Screen total score, ALS Functional Rating Scale (ALS–FRS)) (Fig. 3g,h (sEV), Supplementary Fig. 11i,j (mEV) and Supplementary Table 12). In bvFTD, plasma EV TDP-43 concentrations correlated with cognitive impairment, impaired functional activities, increased symptom severity, more severe psychiatric and behavior symptoms (MMSE, MoCA, FAQ, CDR-SB, CDR plus NACC FTLD, NPI-Q, CBI-M) (Fig. 3i,j (sEV), Supplementary Fig. 11k,l (mEV) and Supplementary Table 9). Plasma EV TDP-43 levels correlated with CSF EV TDP-43 in the ALS group (Supplementary Fig. 12).
Plasma EV TDP-43 levels in pathology-confirmed cases
We next compared plasma EV TDP-43 levels of confirmed TDP-43, tau or non-TDP-43/non-tau pathology cases stratified by clinical diagnosis (Fig. 3k) and independent of clinical diagnosis (Fig. 3l). In the TDP pathology cases, EV TDP-43 was increased compared with HC (median sEV: 63.95 pg ml−1, IQR [42.89–86.63], P < 0.0001), PSP/GGT-type tau (median sEV: 2.85 pg ml−1, IQR [2.10–3.52], P < 0.00001), genetic MAPT (median sEV: 2.86 pg ml−1, IQR [2.53–3.02], P < 0.00001) and the non-TDP-43/non-tau pathology group (median sEV: 11.35 pg ml−1, IQR [10.62–12.05], P < 0.00001) (Fig. 3i; see Supplementary Fig. 13a,b for mEV data). In bvFTD with confirmed TDP-43 pathology, plasma EV TDP-43 levels were higher compared with bvFTD with MAPT mutations (bvFTD with TDP-43 pathology median sEV TDP-43: 36.15 pg ml−1, IQR [4.52–52.65]; bvFTD with MAPT mutations median sEV TDP-43: 2.86 pg ml−1, IQR [2.53–3.02], P < 0.0001). EV TDP-43 levels in PSP/GGT-type tau pathology were comparable with non-TDP-43/non-tau and HC groups (P > 0.05) (Fig. 3l and Supplementary Fig. 13b). Surprisingly, VCP and TBK1 mutation carriers showed low levels of EV TDP-43, although both mutations had been linked to TDP-43 pathology before47,48.
Plasma EV tau ratio and TDP-43 aid the diagnosis of FTD and ALS
In bvFTD, plasma EV TDP-43 concentrations were inversely correlated with EV 3R/4R tau ratios (sEV: r = −0.496, P < 0.0001; Supplementary Fig. 14a,b), indicating that high TDP-43 levels are associated with low tau ratios and vice versa. A plot of plasma sEV TDP-43 concentrations versus sEV 3R/4R tau ratios without genetically and neuropathologically confirmed cases revealed a clear separation of bvFTD cases into two subgroups (Fig. 4a). One of the two bvFTD subgroups, characterized by a low EV tau ratio and high EV TDP-43 levels, overlapped with ALS, whereas the other was characterized by high EV 3R/4R tau ratios but low TDP-43 levels (putative FTLD-TDP and FTLD-tau groups) (Fig. 4a (subcohort 2) and Extended Data Fig. 4 (bvFTD cases only)). PSP and HC groups formed separate clusters.

a, Subcohort 2 without pathology-confirmed cases. Color codes indicate the different clinical diagnostic groups (ALS, bvFTD, PSP, HC). Cut-off values were determined by Gaussian mixture modeling. EV 3R/4R tau ratio cut-offs: 0.77 and 1.28; EV TDP-43 cut-offs: 13.87 pg ml−1 and 56.18 pg ml−1. b, Genetically or neuropathologically confirmed cases were also plotted. c, The ALS–FTD overlap group (ALS with FTD (ALS–FTD), ALS patients with cognitive impairment and ALS patients with behavioral impairment) is indicated in light blue.
We next added pathology-confirmed cases to the graph (Fig. 4b). PSP/GGT-type tau pathology cases formed a cluster characterized by low TDP-43 and 3R/4R tau ratios. The HC group and all non-TDP-43/non-tau cases grouped together, consistent with the absence of TDP-43 and tau pathology. TDP-43-confirmed pathology cases were found in the cluster of ALS and TDP-43 high bvFTD cases. By contrast, bvFTD cases with confirmed MAPT pathology fell into the bvFTD group with high sEV tau ratios.
We applied a mixture modeling approach to sEV 3R/4R tau and sEV TDP-43 data to obtain cut-off values of 0.77 and 1.27 for 3R/4R tau, and 13.87 pg ml−1 and 56.18 pg ml−1 for TDP-43 (Fig. 4, Supplementary Data and Supplementary Fig. 15).
Low plasma sEV 3R/4R tau ratios (<0.77) discriminated clinical PSP cases form all other individuals in subcohort 2 (sensitivity: 93.25%, CI [88.25–96.58%]; specificity: 95.25%, CI [92.68–97.12%]) as well as PSP/GGT-type tau pathology cases from other pathology-confirmed cases (sensitivity: 100%, CI [39.76–100%]; specificity: 100%, CI [93.94–100%]). High plasma sEV 3R/4R tau ratios (>1.27) were found in 38.55% of clinical bvFTD cases. All MAPT mutation carriers, but no other patients with confirmed pathology, fell into the high plasma sEV tau ratio category (sensitivity: 100%, CI [29.24–100%]; specificity: 100%, CI [94.04–100%]). Importantly, all but one of the remaining clinical bvFTD patients (61.45%) showed tau ratios below the upper cut-off (<1.27) but elevated TDP-43 levels (>13.87 pg ml−1), suggesting that sEV measurements can distinguish two separate subgroups among bvFTD patients.
TDP-43 pathology cases mapped to the TDP-43 high bvFTD (putative FTLD-TDP) and the ALS group, and were detected among all individuals with a genetically or neuropathologically proven diagnosis with a sensitivity of 88.00%, CI [76.13–95.67%] and a specificity of 100%, CI [75.29–100%] using the cut-off for at least mildly increased TDP-43 levels (>13.87 pg ml−1) (Fig. 4b).
ALS cases with symptoms overlapping with bvFTD showed elevated plasma sEV TDP-43 levels (Fig. 4c).
Together, our data suggest that a combination of plasma EV TDP-43 and 3R/4R tau may distinguish FTLD-tau from FTLD-TDP.
Sant Pau validation cohort
We validated our findings in samples from the independent Sant Pau cohort49 (ALS (n = 65), ALS–FTD (n = 58), bvFTD (n = 50), FTD mutation carriers (n = 23), PSP (n = 41) and HC (n = 50); see Extended Data Table 3 for patient demographics).
Plasma EV tau ratios are high in bvFTD and low in PSP
Similar to our findings from DESCRIBE, tau ratios were lowest in PSP (median sEV 3R/4R tau ratio 0.38, IQR [0.33–0.50]), compared with all other groups (median sEV HC 1.02, IQR [0.96–1.06], PSP versus HC P < 0.00001; ALS 1.02, IQR [0.92–1.11], PSP versus ALS P < 0.00001; ALS–FTD 0.95, IQR [0.84–1.00], PSP versus ALS–FTD P < 0.00001; bvFTD 1.34, IQR [1.17–2.34], PSP versus bvFTD P < 0.00001) and highest in bvFTD, median sEV bvFTD versus all other diagnostic groups P < 0.00001) (Fig. 5a and Extended Data Table 3 (sEV), and Supplementary Fig. 16a and Extended Data Table 3 (mEV)). No correlations of EV tau ratios with age, sex and disease duration were found (Supplementary Table 13). Approximately half of the bvFTD samples were characterized by high EV tau ratios, indicating tau pathology, whereas the other half were in the range observed for HC, ALS and ALS–FTD. We confirmed the feasibility of using plasma EV tau ratio as a diagnostic marker for different tauopathies by ROC analysis (sEV 3R/4R tau ratio: PSP versus HC (AUC 1.00, CI [0.960–1.000]), PSP versus ALS (AUC 0.99, CI [0.962–1.000]), PSP versus ALS–FTD (AUC 0.98, CI [0.960–1.000]) and PSP versus bvFTD (AUC 1.00, CI [0.969–1.000]); bvFTD versus HC (AUC 0.95, CI [0.905–0.985]) and bvFTD versus ALS (AUC 0.90, CI [0.845–0.948])) (Extended Data Fig. 5a–g and Supplementary Table 14 (sEV), and Supplementary Fig. 16b–h and Supplementary Table 14 (mEV)).

a, Stratified by clinical diagnosis. Horizontal lines indicate the median and IQR. Kruskal–Wallis test with Dunn’s correction for multiple comparisons. HC versus bvFTD P = 0.000009, HC versus PSP P = 0.000007, ALS versus bvFTD P = 0.0000091, ALS versus PSP P = 0.0000016, ALS–FTD versus bvFTD P = 0.0000074, ALS–FTD versus PSP P = 0.0000041, bvFTD versus PSP P = 0.000006; ****P < 0.00001. Biologically independent samples: HC n = 50, ALS n = 65, ALS–FTD n = 58, bvFTD n = 50 (+23 mutation carriers), PSP n = 41. b,c, sEV 3R/4R tau ratios in plasma-derived sEV in genetic cases from Sant Pau cohort (n = 34 genetic cases) stratified by clinical diagnosis (b), HC versus bvFTD P = 0.000009, HC versus PSP P = 0.000007, ALS versus bvFTD P = 0.0000091, ALS versus PSP P = 0.0000016, ALS–FTD versus bvFTD P = 0.0000074, ALS–FTD versus PSP P = 0.0000041, bvFTD versus PSP P = 0.000006; ****P < 0.00001; and stratified by associated molecular pathology and independent from clinical diagnosis (c). The long horizontal line represents the median and the short horizontal lines represent the IQR. Kruskal–Wallis test with Dunn’s correction for multiple comparisons. HC versus TDP-43 P = 0.758, HC versus non-tau/non-TDP-43 P = 0.632, TDP-43 versus non-tau/non-TDP-43 P = 0.425; NS, not significant. TDP-43 pathology group: bvFTD (C9orf72 (n = 12), GRN (n = 6), TARDP (n = 1), VCP (n = 1), TBK-1 (n = 3)); ALS (C9orf72 (n = 3)); ALS–FTD (C9orf72 (n = 1)). Non-tau/non-TDP-43 pathology group: ALS (SOD-1 (n = 3)); FUS (n = 3); ALS–FTD (SOD-1 (n = 1)). d,e, Correlation matrix depicting results of two-sided Spearman correlations in the PSP group, visualized by plotting strength of correlation (r) as a heat map (d) along with P values (e). f,g, Correlation matrix depicting results of two-sided Spearman correlations in the bvFTD group, visualized by plotting strength of correlation (r) as a heat map (f) along with P values (g). h, TDP-43 levels in plasma sEV of the Sant Pau cohort stratified by clinical diagnosis. The long horizontal line represents the median and the short horizontal lines represent the IQR. Kruskal–Wallis test with Dunn’s correction for multiple comparisons. HC versus ALS P = 0.0000075, HC versus ALS–FTD P = 0.0000046, ALS versus bvFTD P = 0.00074, HC versus PSP P = 0.578, ALS versus bvFTD P = 0.000009, ALS versus PSP P = 0.000007, ALS–FTD versus bvFTD P = 0.0000043, ALS–FTD versus PSP P = 0.0000055, bvFTD versus PSP P = 0.0005; *P < 0.05, **P < 0.001, ***P < 0.0001, ****P < 0.00001. Biologically independent samples: HC n = 50, ALS n = 65, ALS–FTD n = 58, bvFTD n = 50 (+23 mutations), PSP n = 41. i,j, Plasma sEV TDP-43 concentrations in genetic cases of the Sant Pau cohort (n = 34 genetic cases) stratified by clinical diagnosis (i), HC versus ALS P = 0.0000075, HC versus ALS–FTD P = 0.0000046, ALS versus bvFTD P = 0.00074, HC versus PSP P = 0.578, ALS versus bvFTD P = 0.000009, ALS versus PSP P = 0.000007, ALS–FTD versus bvFTD P = 0.0000043, ALS–FTD versus PSP P = 0.0000055, bvFTD versus PSP P = 0.0005; and stratified by molecular pathology, independent of clinical diagnosis (j). The long horizontal line represents the median and the short horizontal lines represent the IQR. Kruskal–Wallis test with Dunn’s correction for multiple comparisons. HC versus TDP-43 P = 0.0000063, HC versus non-tau/non-TDP-43 P = 0.541, TDP-43 versus non-tau/non-TDP-43 P = 0.0000051; ****P < 0.00001. TDP-43 pathology group: bvFTD (C9orf72 (n = 12), GRN (n = 6), TARDP (n = 1), VCP (n = 1), TBK-1 (n = 3)); ALS (C9orf72 (n = 3)); ALS–FTD C9orf72 (n = 1). Non-tau/non-TDP-43 pathology group: ALS (SOD-1 (n = 3); FUS (n = 3)); ALS–FTD (SOD-1 (n = 1)). k,i, Correlation matrix depicting results of two-sided Spearman correlations in the ALS group, visualized by plotting strength of correlation (r) as a heat map (k) along with P values (i). ALS-FRS (sEV: r = −0.212), P = 0.015 and time since diagnosis/disease duration (sEV: r = 0.514, P = 0.0004). n,m, Correlation matrix depicting results of two-sided Spearman correlations in the ALS−FTD group, visualized by plotting strength of correlation (r) as a heat map (m) along with P values (n). ALS-FRS (sEV: r = −0.702), P = 0.0002 and time since diagnosis/disease duration (sEV: r = 0.445, P = 0.0005); MMSE (sEV: r = −0.535, P = 0.018).
Sant Pau cohort samples included 34 genetically confirmed cases, 27 with TDP-43 (GRN n = 6, C9orf72 n = 16, TARDBP n = 1, VCP n = 1 and TBK1 n = 3) and 7 with neither TDP-43 nor tau pathology (SOD1 n = 4 and FUS n = 3) (Supplementary Table 15). Consistent with the absence of tau pathology, plasma EV 3R/4R tau ratios of all genetically confirmed cases were in the range of HC, ALS and ALS–FTD (Fig. 5b,c and Supplementary Fig. 22a,b) (HC: median sEV 1.02, IQR [0.96–1.06]; TDP-43 pathology group: median sEV 1.15, IQR [1.07–1.23], versus HC P > 0.9999; non-TDP-43/non-tau group: median sEV 0.92, IQR [0.84–1.15], versus HC P > 0.9999).
Plasma EV tau ratios correlate with disease severity
Plasma EV 3R/4R tau ratios correlated with plasma NfL and clinical measures of disease severity in bvFTD and inversely in PSP (Fig. 5d–g (sEV), and Supplementary Fig. 16k,n and Supplementary Tables 16 and 17 (mEV)).
High plasma EV TDP-43 in ALS, ALS–FTD and a subset of bvFTD
As in DESCRIBE subcohort 2, plasma EV TDP-43 levels were increased in patients with ALS (median sEV TDP-43: 45.60 pg ml−1, IQR [31.55–64.45]) compared with HC (median sEV TDP-43: 10.41 pg ml−1, IQR [8.50–14.65], P < 0.00001), in ALS–FTD (median sEV TDP-43: 52.40 pg ml−1, IQR [39.18–73.43], P < 0.00001 compared with HC) and in bvFTD (median sEV TDP-43: 24.15 pg ml−1, IQR [11.13–40.55], P < 0.00001 compared with HC) (Fig. 5h (sEV), and Supplementary Fig. 19a and Extended Data Table 3 (mEV)). PSP EV TDP-43 levels were comparable with HC (median sEV TDP-43: 10.20 pg ml−1, IQR [8.30–12.35], P > 0.9999). Plasma sEV TDP-43 distinguished ALS from HC, PSP and bvFTD with AUC values of 0.94, CI [0.892–0.981], 0.96, CI [0.910–0.991] and 0.76, CI [0.687–0.832] (Supplementary Table 14), and ALS–FTD from HC, PSP and bvFTD groups (AUC 0.98, CI [0.946–0.999], 0.99, CI [0.955–1.000] and 0.82, CI [0.745–0.881]) (Supplementary Fig. 19a–g (sEV), Supplementary Fig. 18b–h) (mEV) and Supplementary Table 14).
Genetic cases linked to TDP-43 pathology were characterized by high EV TDP-43 levels (median sEV TDP-43: 55.0 pg ml−1, IQR [35.0–66.4]), with the exception of VCP and TBK1 mutations similar to what we observed in the DESCRIBE cohort. Genetically confirmed cases, neither linked to TDP-43 nor tau, displayed low plasma EV TDP-43 levels (median sEV TDP-43: 12.7 pg ml−1, IQR [11.3–15.7]), comparable to HC and PSP (HC median sEV TDP-43: 10.41 pg ml−1, IQR [8.50–14.65]; PSP median sEV TDP-43: 10.20 pg ml−1, IQR [8.30–12.35]) (Fig. 5i,j and Supplementary Fig. 19a,b).
Plasma EV TDP-43 discriminated bvFTD cases from HC, PSP, ALS and ALS–FTD (AUC sEV: bvFTD versus HC 0.87, CI [0.803–0.926]; versus PSP 0.91, CI [0.851–0.959]; versus ALS 0.76, CI [0.687–0.832]; versus ALS–FTD 0.82, CI [0.745–0.881]) (Extended Data Fig. 6i and Supplementary Table 14 (sEV), and Supplementary Fig. 18h–j and Supplementary Table 14 (mEV)). Comparable with our results from DESCRIBE, plasma EV TDP-43-based AUCs performed superior to NfL for bvFTD versus HC and PSP (plasma NfL AUCs: bvFTD versus HC 0.78, CI [0.734–0.842]; versus PSP 0.71, CI [0.689–0.789]; P < 0.0001 for all AUC comparisons) (Extended Data Fig. 7a,b (sEV), and Supplementary Fig. 23i,j and Supplementary Table 14 (mEV)). NfL measurements were not available for ALS and ALS–FTD in the Sant Pau cohort.
Plasma EV TDP-43 correlates with disease severity
Plasma EV TDP-43 levels correlated highly with plasma NfL concentrations in bvFTD (sEV: r = 0.513, P < 0.0001; mEV: r = 0.465, P < 0.0001) (Extended Data Fig. 2e–g (sEV) and Supplementary Fig. 20k (mEV)).
In ALS and ALS–FTD, higher plasma EV TDP-43 levels were associated with increased disease severity (ALS-FRS, time since diagnosis, MMSE; Fig. 5k–n (sEV), Supplementary Fig. 18l–o and Supplementary Tables 18 and 19a (mEV)).
In bvFTD, plasma EV TDP-43 concentrations correlated with cognitive impairment, increased symptom severity and more severe psychiatric symptoms (Fig. 5f,g (sEV), Supplementary Fig. 23p,r (mEV) and Supplementary Table 17).
Determination of cut-off levels
Plasma EV TDP-43 concentrations in bvFTD were inversely correlated to EV 3R/4R tau ratios (sEV: r = −0.714, P < 0.0001; mEV: r = −0.617, P < 0.0001; Supplementary Fig. 20a,b). A plot of plasma sEV TDP-43 concentrations versus sEV 3R/4R tau ratios without genetic cases showed a similar distribution of the diagnostic groups as observed for DESCRIBE subcohort 2 and a separation of putative bvFTD TDP and tau subgroups (Fig. 6a). The TDP-43 high bvFTD subgroup overlapped with the ALS group (Fig. 6a), cases with confirmed TDP-43 pathology (Fig. 6b) and the ALS–FTD group (Fig. 6c). Cases with confirmed non-tau/non-TDP-43 pathology overlapped with the HC group (Fig. 6b).

a, Sant Pau cohort without pathology-confirmed cases. Color codes indicate the different clinical diagnostic groups (ALS, bvFTD, PSP, HC). Cut-off values as determined by Gaussian mixture modeling. EV 3R/4R tau ratio cut-offs: 0.78 and 1.28; EV TDP-43 cut-offs: 17.85 pg ml−1 and 57.34 pg ml−1. b, Genetically confirmed cases were also plotted in the graph. c, The ALS–FTD overlap group is indicated in light blue. d–f, Sant Pau cohort without pathology-confirmed cases (d), Sant Pau cohort including pathology-confirmed cases (e) and Sant Pau cohort, ALS–FTD group indicated in light blue (f). Similar to a–c but superimposed with Sant Pau and DESCRIBE cut-offs. The black solid line indicates Sant Pau cut-offs (EV 3R/4R tau ratio cut-offs: 0.78 and 1.28; EV TDP-43 cut-offs: 17.85 pg ml−1 and 57.34 pg ml−1). The red dashed line indicates DESCIRBE subcohort 2 cut-offs (EV 3R/4R tau ratio cut-offs: 0.77 and 1.28; EV TDP-43 cut-offs: 13.87 pg ml−1 and 56.18 pg ml−1).
Cut-offs were defined by mixture modeling (Supplementary Fig. 21), excluding genetically confirmed cases for subsequent testing of cut-offs (sEV 3R/4R tau ratio: 0.78 and 1.28; sEV TDP-43: 17.85 pg ml−1 and 57.34 pg ml−1; Fig. 6d–f, black lines). Cut-offs were very close to those in DESCRIBE subcohort 2. sEV 3R/4R tau ratio: 0.77 and 1.28; sEV TDP-43 cut-offs: 13.87 pg ml−1 and 56.18 pg ml−1.
The Sant Pau TDP-43 cut-off (>17.85 pg ml−1) detected confirmed TDP-43 pathology cases among all individuals with a genetically proven diagnosis with a sensitivity of 88.89%, CI [70.84–97.65%] and a specificity of 85.71%, CI [42.13–99.64%].
Low plasma sEV 3R/4R tau ratios (<0.78, Sant Pau cohort cut-off) discriminated PSP cases form all other diagnoses (sensitivity: 100%, CI [91.40–100%]; specificity: 94.00%, CI [90.30–96.60%]). Similar results were obtained when applying the DESCRIBE cohort cut-off to Sant Pau data (sensitivity: 100%, CI [91.40–100%]; specificity: 94.94%, CI [91.77–97.50%]).
Fifty-eight percent of sporadic bvFTD patients in the Sant Pau cohort showed high plasma sEV 3R/4R tau ratios (>1.28), indicative of tau pathology. Of those with tau ratios below this cut-off (42%), all but one showed EV TDP-43 levels above the TDP cut-off, further supporting that sEV tau ratio and TDP-43 measurements can distinguish two separate bvFTD subgroups.
The Sant Pau EV TDP-43 cut-off identified patients with sporadic ALS and ALS–FTD with high sensitivity and specificity versus HC and PSP (ALS sensitivity: 86.15%, CI [75.34–93.47%]; specificity: 100%, CI [96.03–100%]; ALS–FTD sensitivity: 96.55%, CI [88.90–99.58%]; specificity: 100%, CI [96.03–100%]). Applying the DESCRIBE subcohort 2 cut-off values to Sant Pau resulted in a sensitivity of 89.23% (CI [79.06–95.56%]) and a specificity of 90.11% (CI [82.05–95.38%]) for ALS, and a sensitivity of 100% (CI [93.84–100%]) and specificity of 90.11% (CI [82.05–95.38%]) for ALS–FTD.
Together, these data indicate that cut-offs are nearly interchangeable between the two cohorts.
Discussion
Currently, there are no biomarkers available for ALS, FTD and FTD spectrum disorders that define the underlying proteinopathies. A low-invasive fluid biomarker for the identification of molecular pathology would allow pathology-based stratification of patients to clinical trials and strongly advance the development of new disease-modifying therapies. In light of novel therapeutic approaches in ALS and FTD, such biomarkers are strongly desired.
Our study in a large cohort of 704 patients, including 37 genetically and 31 pathologically confirmed samples as well as in an independent validation cohort of 287 patients with 34 genetically confirmed cases, shows that plasma EVs inform about tau and TDP-43 pathology in bvFTD, and can additionally discriminate patients with ALS and PSP from healthy and neurodegenerative disease controls with high diagnostic accuracy (AUC > 0.91).
High plasma EV 3R/4R tau ratios in bvFTD were characterized by low EV TDP-43 levels and both markers separated bvFTD into two distinct groups, which can be discriminated based on cut-off values derived from mixture modeling. Plasma EV 3R/4R tau ratios in confirmed cases with TDP-43 pathology displayed low 3R/4R tau ratios, comparable with values in the HC group, but high TDP-43 levels. By contrast, MAPT mutation carriers showed high EV 3R/4R tau ratios and mapped to the bvFTD tau subgroup. Clinically diagnosed PSP, including neuropathologically proven cases of PSP-type tauopathy, segregated into a third group, characterized by a decreased EV 3R/4R tau ratio and EV TDP-43 levels in the range of HC.
It is unclear why the EV 3R/4R tau ratio is low in PSP but high in bvFTD cases with FTLD-tau. 4R tau predominance may explain low 3R/4R tau ratios in PSP; however, all three MAPT mutation carriers in DESCRIBE showed high 3R/4R tau ratios, despite being associated with 4R tau pathology. It is possible that different ‘strains’, posttranslational modifications or regional and cellular distribution of pathology may result in differential sorting of 3R and 4R tau isoforms to EVs in different tauopathies50.
Plasma EV TDP-43 levels distinguished ALS from all other groups with high diagnostic accuracy (AUC ≥ 0.91 versus HC, PSP, bvFTD in DESCRIBE; AUC ≥ 0.94 versus HC, PSP; and AUC ≥ 0.76 versus bvFTD in the Sant Pau cohort). Cases with confirmed TDP-43 pathology were characterized by high EV TDP-43 levels, whereas ALS cases with mutations that are not linked to TDP-43 pathology displayed low EV TDP-43 concentrations, comparable with HC.
Unexpectedly, cases with VCP and TBK1 mutations failed to show increased EV TDP-43 levels, although mutations in both genes have been linked to TDP-43 pathology47,48. One potential explanation could be the predominance of intranuclear lentiform inclusions and impaired endolysosomal protein sorting described in VCP mutation carriers, which may prevent release of TDP-43 with EVs51. Overactivation of TBK-1 can increase neuronal EV release52. Thus, TBK-1 loss-of-function mutations may impair EV secretion. Indeed, plasma EV concentrations in TBK-1 mutation carriers were approximately three times lower than the cohorts’ mean plasma EV concentration (Supplementary Fig. 22).
In PSP and bvFTD, plasma EV tau ratios correlated with NfL, clinical, cognitive and behavior scales reflecting disease pathology, similar to plasma EV TDP-43 in ALS and bvFTD, including trial-relevant scales such as ALS-FRS-revised and CDR-SB. Plasma EV 3R/4R tau and TDP-43 may have the potential to mirror disease progression and could, after positive evaluation in longitudinal cohort samples and therapeutic intervention trials, potentially be used as a progression and surrogate marker for clinical studies.
We focused on plasma EV measurements due to several reasons:
-
(1)
Plasma albumin and immunoglobulins can interfere with antibody binding53 but are largely absent in plasma EV preparations26, which may facilitate TDP-43 detection.
-
(2)
Full-length tau concentrations in blood are extremely low because of tau fragmentation. By contrast, EV cargo is protected from degradation54, which allows reliable quantification of 3R and 4R tau isoforms in plasma EVs.
-
(3)
Increased EV levels of tau or TDP-43 in extracellular fluids may reflect disease pathology. Both tau and TDP-43 can be transported by EVs to other cells where they can induce protein aggregation. Cytoplasmic (mis)localization of TDP-43 is likely required for its secretion with EVs, and its release with EVs may mirror the nuclear to cytoplasmatic shift of TDP-43 observed in ALS and FTD.
Although our cohort included a high number of confirmed TDP-43 cases, future studies with additional confirmed FTLD-tau cases are needed, as well as measurements from preclinical disease stages, to determine how early these biomarkers increase before symptom onset. Cross-sectional and longitudinal samples need to be analyzed in additional, independent and ethnically more diverse cohorts (imbalanced group sizes in DESCRIBE subcohort 2: Supplementary Data).
EVs can pass the blood–brain barrier55 but it is not known to what extent plasma EV TDP-43 or tau stem from the CNS because both are expressed in peripheral tissue27,56,57. The correlation of CSF with plasma EV TDP-43 in ALS supports the notion that plasma EV TDP-43 may reflect CNS pathology. Plasma EV tau and TDP-43 are almost exclusively found in L1CAM-positive EVs, which could further support a potential brain origin, although the neuronal specificity of L1CAM and its association with EVs are controversially discussed30.
Strengths of our study are the large numbers of patient samples, 991 in total, and the independent validation in another cohort, containing altogether 97 genetically and/or neuropathologically confirmed samples. Our work is the first study, to our knowledge, demonstrating a blood-based, and therefore low invasive and easily accessible, fluid biomarker, which has great potential as a diagnostic marker to distinguish FTLD-TDP from FTLD-tau, and to detect ALS and PSP. Cut-off values determined by Gaussian mixture modeling were remarkably transferable between the different cohorts, particularly tau ratio cut-offs. Plasma mEVs may even offer faster and easier preparation than sEVs, although in our study, sEVs performed slightly better.
Our work may also have important implications for AD, where limbic predominant TDP-43 co-pathology has been described in up to 55% of cases58,59 and is associated with a more aggressive clinical course60. A combination of ‘classical’ AD biomarkers with plasma EV TDP-43 may help to stratify AD cases with and without limbic predominant TDP-43 co-pathology pathology.
In summary, with EV 3R/4R tau and EV TDP-43 we describe the first marker that specifically detects underlying molecular pathology in patients with ALS, FTD and FTD spectrum disorders, whereas previously suggested biomarkers reflect downstream effects such as neurodegeneration (NfL)61,62 or inflammation (glial fibrillary acidic protein)63,64.
Methods
Patient samples
The DZNE Clinical Registry Study of Neurodegenerative Diseases (DESCRIBE) cohort is a multicentric, longitudinal observational study conducted by the German Center for Neurodegenerative Diseases (DZNE) and its clinical sites. It recruits patients with different neurodegenerative conditions, including ALS, bvFTD and PSP. Recruitment of these patients is described in more detail below. The multicenter, longitudinal Degeneration Controls and Relatives cohort (DANCER) serves to provide HCs for all DESCRIBE subcohorts. After written informed consent (University of Bonn Ethics Board statement 311/14) all participants undergo baseline and annual follow-up visits with clinical and neurological examination, cognitive assessments, 3T magnetic resonance imaging (MRI), blood and CSF sampling following identical standard operating procedures. Patients with AD dementia were recruited as part of the DESCRIBE cohort, following the National Institutes of Aging–Alzheimer’s Association diagnosis criteria65 and confirmed by positive CSF amyloid-beta, total tau and p-tau181 status.
The DESCRIBE cohort
The DESCRIBE ALS cohort
ALS patients were diagnosed according to the revised El Escorial Criteria66. Different motor phenotypes of ALS were classified as classical ALS, progressive bulbar paresis, flail arm, flail leg, progressive muscular atrophy, primary lateral sclerosis or genetic ALS. Participants were clinically characterized using the Amyotrophic Lateral Sclerosis Functional Rating Scale-revised67. The Edinburgh Cognitive and Behavioral ALS Screen68 served as an additional test to identify cognitive and behavioral impairment. ALS patients with cognitive impairment, ALS with behavioral impairment, ALS with cognitive and behavioral impairment, ALS–FTD following the Strong criteria69 and genetic ALS with a pathogenic FTD mutation also underwent the assessments of the DESCRIBE FTD cohort.
The DESCRIBE FTD cohort
Patients with bvFTD were diagnosed according to the revised Rascovsky criteria70 by an experienced multidisciplinary team of neurologists, psychiatrists and neuropsychologists, and under consideration of MRI and CSF data, when available. Neuropsychological assessments included MMSE, the MoCA58, Free and Cued Selective Reminding Test71, the Neuropsychological battery of the Consortium to Establish a Registry for Alzheimer’s Disease Plus test72 including Trail Making Tests A and B and the mini-Social cognition & Emotional Assessment test73. Psychiatric scales included Geriatric Depression Scale74, the brief questionnaire of the NPI-Q45, and the functional scales CDR-SB, CDR plus NACC FTLD, FAQ42 and a modification of the revised Cambridge Behavior Inventory46, the CBI-M.
Patients with svPPA were diagnosed according to Gordon-Tempini criteria75. Baseline assessment of patients with PPA additionally included a modified version of the Camel and Cactus test76, the visual form of the Sentence Comprehension Test77, the Sentence Repetition Test from the Aachen Aphasia Test78, hierarchical word lists79 and the Repeat and Point Test80.
The DESCRIBE PSP cohort
The cohort design is summarized in ref. 81. Diagnosis of PSP was based on the National Institute of Neurological Disorders and Stroke and the Society for PSP criteria82 for participants recruited before 2017, and on the Movement Disorder Society (MDS-PSP) diagnostic criteria83 for participants recruited after 2017. Participants were clinically phenotyped by the PSP-RS35, PSP-SS35, PSP-QoL41, PSP-CDS36, SEADL37, MDS-UPDRS Part III39, SAS40, CGI-s38, Geriatric Depression Scale74 and MoCA34.
The healthy control cohort DANCER
HC samples were obtained from DANCER and included 71 participants who, based on neuropsychological testing, neurological and psychiatric examination, do not suffer from a neurodegenerative disease. Participants additionally underwent MRI. The neuropsychological test battery follows the same protocol and includes all assessments as the one used for participants of the DESCRIBE FTD cohort. Participants undergo an annual follow-up as well as genetic testing at baseline (see below). Relatives with a known pathogenic FTD–ALS mutation were excluded as controls.
Genetics
All patients with a diagnosis of bvFTD, FTD–ALS, ALS with cognitive and or behavior impairment, and all control subjects were tested for pathogenic C9orf72 hexanucleotide repeat expansions, for insertions or deletions in MAPT and GRN genes by multiplex ligation-dependent probe amplification and for other protein-coding variants by whole-exome sequencing. Specifically, expansions of the C9orf72 GGGGCC hexanucleotide repeat were detected by the AmplideX PCR/CE C9orf72 kit (Asuragen) with a cut-off value of 30 repeats defining pathologically expanded repeats. For detection of deletions or duplications in GRN and MAPT genes we employed the SALSA multiplex ligation-dependent probe amplification kit (MRC-Holland). Participants with ALS and PSP were not systematically screened for mutations as part of the DESCRIBE study protocol. Our study sample contained 37 mutation carriers, including 18 C9orf, 4 GRN, 3 MAPT, 4 VCP, 2 TBK1, 2 CHCHD10, 2 FUS and 2 SOD-1 cases (Supplementary Table 10).
DZNE Brain Bank postmortem cohort and neuropathological diagnosis
In the DZNE Brain Bank, autopsies and sampling of tissues for diagnostics and research is performed after written informed consent in accordance with local ethics review boards. Brain autopsies and neuropathological diagnosis were available for 31 participants from subcohort 2, consisting of 24 cases with a TDP-43 proteinopathy (ALS-TDP and FTLD-TDP, including 2 cases with TBK1 mutation), 5 cases with a tau proteinopathy (PSP and FTLD-tau including 1 case with MAPT mutation), as well as 1 ALS with a mutation in SOD-1 and 1 ALS case with a CHCHD10 mutation (Supplementary Table 11).
Neuropathological evaluation was performed for all cases on formalin-fixed paraffin-embedded tissue sections from 20 standardized neuroanatomical regions following guidelines for the assessment and diagnosis of neurodegenerative diseases including immunohistochemistry with antibodies against phosphorylated TDP-43 (clone 1D3)84, phosphorylated tau (clone AT8, Thermo Fisher), α-synuclein (clone 4D6, Origene) and beta-amyloid (clone 4G8, Covance). For all cases, assessment included reporting of AD neuropathological changes85 and presence/regional distribution of Lewy pathology86. Cases with FTLD-TDP were subclassified according to current criteria87.
The Sant Pau cohort
Patients with ALS were prospectively recruited from the Motor Neuron Disease Clinic at Hospital de la Santa Creu i Sant Pau. We included patients categorized as probable laboratory-supported or definite ALS according to El Escorial revised criteria88. ALSFRS-R in its Spanish version89 was systematically assessed at the time of sample acquisition. Unimpaired HCs, bvFTD and PSP patients were recruited at the Sant Pau Memory Unit and include individuals from the Sant Pau Initiative on Neurodegeneration multimodal biomarker cohort. ALS–FTD patients were recruited by Sant Apu Memory Unit and Motor Neuron Disease Clinic. Information about clinical and neuropsychological assessments and sample processing have been previously described in detail49. Plasma samples were obtained using the same standard operating procedure. All patient samples (ALS, ALS–FTD, bvFTD and PSP) were screened for the presence of a pathogenic repeat expansion mutation in C9orf72. In addition, patients with ALS were tested for mutations in genes causing ALS, FTD and AD using a gene panel. bvFTD and PSP patients underwent whole-exome sequencing. In total, pathogenic mutations were found in C9orf72 (n = 16), GRN (n = 6), SOD1 (n = 4), TBK1 (n = 3), FUS (n = 3), TARDBP (n = 1) and VCP (n = 1). This study was approved by the Hospital de la Santa Creu i Sant Pau Ethics Committee. Written informed consent was obtained from all participants.
EV isolation from plasma and CSF
EVs were prepared from EDTA plasma as described in ref. 26 by a blinded experimentator. Briefly, 500 μl of plasma was thawed on ice and subjected to serial centrifugation to isolate sEVs and mEVs. To remove cellular debris, plasma was centrifuged for 10 min at 4 °C and 3,500g, and twice at 4,500g. The supernatant was subsequently centrifuged for 30 min at 10,000g and 4 °C. The resulting pellet (mEV fraction) was resuspended in 100 μl of PBS, 1% CHAPS, whereas the supernatant was applied to size-exclusion columns equilibrated with 10 ml of 20 mM HEPES buffer (pH 7.4) to isolate sEVs (qEVoriginal, 70 nm+; Izon Science Limited). Using the Izon Automatic Fraction Collector and by adding 20 mM HEPES buffer (pH 7.4), we eluted 24 fractions with a volume of 500 μl. As shown previously26, fractions 7–10 contain the highest EV concentrations without contamination by nonvesicular plasma proteins. We therefore pooled fractions 7–10 as the sEV fraction and subjected them to 4,000g centrifugation at 4 °C in an Amicon Ultra centrifugal filter with a 3-kDa cut-off (Merck Millipore) for 40 min at 20 °C to concentrate the sample. Subsequently, the volume was filled up with 10% CHAPS in a 20-mM HEPES to a final concentration of 1% CHAPS (300 µl). Samples were divided in three, stored at −20 °C until further analysis of tau and TDP-43 content. CSF EV for correlation analysis of CSF and plasma EV tau levels were prepared from all DESCRIBE subcohort 1 cases, following the same protocol as for plasma EVs, with a starting volume of 1.5 ml of CSF. We prepared CSF EV for correlation analysis with corresponding plasma EV TDP-43 levels for all ALS cases in DESCRIBE subcohort 2 for which CSF was available (n = 41). A starting volume of 1 ml of CSF was used. Of note, in all cases CSF was drawn at the same visit as plasma samples.
In all cohorts, we aimed for sex-balanced and age-balanced diagnostic groups. The sex of participants was determined based on self-report.
L1CAM immunocapture assay
Plasma (500 µl) was thawed on ice and subjected to serial centrifugation to isolate mEVs and sEVs as described above. mEVs were resuspended in 300 µl of PBS. sEV preparations were concentrated to a final volume of 300 µl, which was divided into three aliquots of 100 µl each. L1CAM immunoisolation from EV preparations was performed as described previously90. In brief, 100 μl of sEVs were diluted in 400 μl of double-distilled H2O supplemented with protease and phosphatase inhibitors and 3% bovine serum albumin. Dilutions were incubated for 60 min with 2.7 µg of biotinylated mouse anti-human CD171 (L1CAM neural adhesion protein) antibody (clone 5G3; eBiosciences) at room temperature and under constant shaking at 800 rpm. For the IgG control condition, 2.7 µg of biotinylated mouse immunoglobulin G2 (IgG2) antibody (clone eBM2a; cat. no. 13-4724-85, Thermo Fisher Scientific) was added instead of anti-human CD171 antibody. Subsequently, 26 µl of streptavidin agarose Ultralink resin (Thermo Fisher Scientific) was added followed by 60 min of incubation at room temperature and shaking at 800 rpm. Solutions were centrifuged for 10 min at 800g at 4 °C and pellets were resuspended for 10 s in 50 µl of cold 0.1 M glycine–HCl (pH 3.0) followed by centrifugation at 4 °C and 4,500g for 5 min. The supernatant was transferred to tubes containing 50 µl of 3% bovine serum albumin in 1 M Tris–HCl (pH 8.0). Aliquots of 5, 15 and 80 µl were used for nanoparticle tracking analyzer (NTA), western blot and TDP-43 or tau analysis by SIMOA or electrochemiluminescence/Meso Scale discovery (MSD)/ELISA, respectively. Before TDP-43 and tau analysis, CHAPS was added at a final concentration of 1%.
Western blotting
Western blotting was performed according to standard protocols using 10% or 12% sodium dodecyl sulfate polyacrylamide gels, followed by transfer to polyvinylidene fluoride (PVDF) membranes (Millipore). PVDF membranes were blocked for 30 min in 4% w/v nonfat dried milk in TBS-Tween 0.5% v/v (TBS-T). Primary antibodies were incubated with the PVDF membrane overnight at 4 °C, and secondary antibodies for 1 h at room temperature. Protein bands were visualized using an ECL western blotting detection kit (GE Healthcare). The following antibodies were used. (1) Primary antibodies: anti-Calnexin (1:2,000 dilution; cat. no. C4731, Sigma-Aldrich), anti-Flotillin-2 (1:500 dilution; cat. no. 610384, BD Biosciences); anti-3R tau (RD3 anti 3R tau antibody; 1:500 dilution; cat. no. 05-803, Merck), anti-4R tau (anti-4R tau antibody; dilution 1:500; cat. no. ab218314, Abcam), and anti-TDP-43 antibody (dilution 1:500; cat. no. ab305694, Abcam). (2) Secondary antibodies: HRP antimouse IgG (1:5,000 dilution; Dako), HRP antirabbit IgG (1:5,000 dilution; Dako).
Nanoparticle tracking analyzer
NTA was performed with a NanoSight LM10 instrument and a LM14 viewing unit equipped with a 532 nm laser (NanoSight, Malvern Instruments) by a blinded experimentator. Samples were recorded in quadruplicates for 30 s and analyzed with the NTA 2.3 software.
Development of 3R and 4R isoform-specific tau immunoassays
We developed two sandwich immunoassays for the specific detection of 3R and 4R tau isoforms, using antibody pairs of isoform-specific tau antibodies with HT7, an antibody raised against an N-terminal, isoform-independent epitope (amino acids 159–163).
Detection of 3R and 4R tau in plasma EVs and the specificity of the antibodies was demonstrated by western blot analysis with recombinant 3R and 4R tau proteins (Supplementary Fig. 3a–e).
Optimal dilutions of capture and detection antibodies were standardized, using the checkerboard method with serially increasing dilutions of capture and detection antibodies, different dilution buffers, incubation times, temperatures and EV lysis methods. The reproducibility of each assay was tested by performing them at least three times with technical replicates. Immunoassay performance parameters such as precision, intra-assay and interassay variability, matrix effect, linearity and parallelism were determined for both 3R and 4R tau assays in plasma-derived sEVs and mEVs using three biological replicates (Supplementary Table 1).
3R tau immunoassay
Plasma sEV and mEV 3R tau were measured in duplicate, 50 μl per well, by a blinded experimentator. Briefly, 96-well multiarray plates (Meso Scale Discovery) were coated with RD3 anti-3R tau antibody (cat. no. 05-803, Merck) after 1:600 dilution in Dulbecco´s Phosphate Buffered Saline overnight at 4 °C. After washing three times with 0.05% Tween-20 in Dulbecco´s Phosphate Buffered Saline (PBST), plates were blocked at room temperature with 150 μl of blocking buffer per well for 1 h under shaking at 350 rpm. Protein standards were prepared from 3R recombinant tau (htau23) by serial 2× dilution in blocking buffer (7,000 pg ml−1 highest standard to 109.38 pg ml−1 lowest standard). Standards and samples were incubated at room temperature under shaking at 350 rpm for 2 h, followed by washing three times with PBST. Plates were then incubated for 1 h at room temperature with the detection antibody, biotinylated anti-total tau HT7 (product no. MN1000B, Thermo Fisher Scientific, epitope residues 159–163), at a 1:300 dilution in blocking buffer and under shaking at 350 rpm. After washing three times in PBST, 50 μl of sulfo-tagged streptavidin (Meso Scale Discovery) was added in a 1:300 dilution per well and incubated for 1 h at room temperature in the dark and under shaking at 350 rpm. Plates were then washed three times and each well was incubated with 150 µl of 2× MSD Reading Buffer T (Meso Scale Discovery). Plates were then measured using a Sector Imager 6000 and the MSD Discovery Workbench 3.0 Data Analysis Toolbox (Meso Scale Discovery).
4R tau immunoassay
Plasma sEV and mEV 4R tau were measured in duplicate, 50 μl per well, by a blinded experimentator. Plates (cat. no. DY008, Biotechne) were incubated with capture antibody directed against 4R tau (Abcam 4R antibody; [EPR21725], cat. no. ab218314) in 100 μl of a 1:300 dilution in plate-coating buffer (R&D DY008 kit) for 18 hours at room temperature and under constant shaking at 150 rpm. After washing three times washing in 1× washing buffer (R&D DY008 kit), blocking buffer (10× diluted in dPBS, R&D blocking buffer, containing 0.1× HAMA blocker (cat. no. ab193969, Abcam)) was added to each well and the mixture was incubated at room temperature for 1 h under shaking at 350 rpm. Wells were subsequently washed three times in washing buffer. 4R tau standard was prepared from recombinant 4R tau (htau40) by serial dilution in blocking buffer (standard 1 (7,000 pg ml−1) to standard 7 (109.48 pg ml−1)). Standard and samples were incubated for 2 h 20 min at room temperature under shaking at 350 rpm. After washing three times, wells were incubated under shaking at 350 rpm for 2 h at room temperature with detection antibody (biotinylated total tau HT7, 1:300 dilution in blocking buffer; product no. MN1000B, Thermo Fisher Scientific), followed by washing three times and incubation with streptavidin HRP (R&D Systems) for 30 min at room temperature in the dark with shaking at 350 rpm. Next, wells were washed three times and incubated for 15 min with substrate solution (R&D DY008 kit) and subsequently with stop solution. The plates were subsequently measured immediately using a BMG Fluostar ELISA reader.
TDP-43 SIMOA assay
TDP-43 levels were determined from plasma, plasma sEV and mEV fractions using the human TDP-43 Advantage kit on a SIMOA HD-X analyzer, software v.3.1 (Quanterix) by a blinded experimentator following the manufacturer’s instructions. As per the product information, the assay was developed against TDP-43 amino acids 203–209 and the C-terminal region. Samples were thawed on ice and randomized on plates. Plasma samples were measured in duplicate, and sEV and mEV samples as singlets, 50 μl per well.
Plasma EV TDP-43 levels were sometimes low in the HC and PSP groups, with 28 sample measurements below the lower limit of quantification, most likely reflecting the absence of TDP-43 alterations in these groups. Such floor effects could be a limiting factor; however, they can be easily overcome by using larger plasma volumes (>500 μl) for sample preparation, if necessary.
Plasma NfL SIMOA assay
Plasma NfL concentrations were determined in duplicate, as previously described91, using the SIMOA NF-light Advantage kit on a Quanterix HD1 analyzer (Quanterix) by a blinded experimenter according to the manufacturer’s instructions.
Statistical analysis
Statistical analysis and data visualization were performed using Prism 7 (GraphPad Software), SPSS Statistics 21 (IBM) and R (R Foundation for Statistical Computing) software programs. The statistical tests were two-tailed and values with P < 0.05 were considered significant.
Comparisons of marker levels were performed using Kruskal–Wallis tests followed by Dunn’s correction for multiple comparisons because of non-Gaussian distributions. Normal distribution assumption was assessed based on visual inspection of histograms and Kolmogorov–Smirnov tests.
To assess the link between EV marker and clinical scales as well as plasma NfL, Spearman correlations were used. To illustrate associations between plasma NfL and plasma EV 3R/4R tau ratio, plasma NfL and plasma EV /TDP-43, as well as plasma EV 3R/4R tau and plasma EV TDP-43 (Figs. 1, 2 and 4 and Supplementary Figs. 5, 7, 11 and 14), monotonic regression splines (using the ‘cgam’ function from R package ‘splines’) were modeled. Notably, potential confounders (age, sex and disease duration) showed no influence on plasma biomarker levels (Supplementary Tables 3 and 7). We therefore used the nonparametric tests described above with covariate adjustment to account for violations of normal distribution assumptions and nonlinear relationships.
MedCalc software was used for computation and comparison of ROC curves, using the method of Hanley and McNeil92 (standard error, 95% CI for the difference and P value), as well as for calculation of sensitivity and specificity. Precision recall curves, area under the precision recall curve and CIs were calculated using the R code from ref. 93 and published prevalence estimates for the different diagnoses (PSP94, ALS95, bvFTD96).
The cut-off values of 3R/4R tau ratio and TDP-43 levels were defined with Gaussian mixture modeling using the R statistical software program v.3.2.1 mix tools package as previously described in ref. 42. First, the R boot.comp function was used to determine the number of distributions that fitted best to the data. Next, we defined data-driven cut-offs as the point at which the lines of fitted normal distributions crossed each other. Specifically, we derived three normal distributions (as suggested by bootstrapping) and determined the intersection of the middle normal distribution with the two more extreme distributions. We computed sensitivity and specificity based on the cut-offs of plasma sEV 3R/4R tau ratio and TDP-43 levels as determined by mixture modeling.
A description of the CBI-M, transmission electron microscopy, cell culture and small interfering RNA transfection, immunoprecipitation–mass spectrometry of tau, preparation of recombinant tau protein and assay validation are given in the Supplementary Methods.
Reporting summary
Further information on research design is available in the Nature Portfolio Reporting Summary linked to this article.
Data availability
The data that support the findings of this study are available from the authors but restrictions apply to the availability of these data, and so they are not publicly available. Data are, however, available from the authors upon reasonable request and with permission from the cohorts’ steering committees (contact for and information on data access: anja.schneider@dzne.de). Expected turnover times for data applications is 3 months.
Code availability
The code used to conduct analyses is described in Methods.
References
Abramzon, Y. A., Fratta, P., Traynor, B. J. & Chia, R. The overlapping genetics of amyotrophic lateral sclerosis and frontotemporal dementia.Front. Neurosci. 14, 42 (2020).
Chare, L. et al. New criteria for frontotemporal dementia syndromes: clinical and pathological diagnostic implications. J. Neurol. Neurosurg. Psychiatry 85, 865–870 (2014).
Mann, D. M. A. & Snowden, J. S. Frontotemporal lobar degeneration: pathogenesis, pathology and pathways to phenotype. Brain Pathol. 27, 723–736 (2017).
Mandelkow, E. & Mandelkow, E. M. Microtubules and microtubule-associated proteins. Curr. Opin. Cell Biol. 7, 72–81 (1995).
Mackenzie, I. R. & Neumann, M. Molecular neuropathology of frontotemporal dementia: insights into disease mechanisms from postmortem studies. J. Neurochem. 138, 54–70 (2016).
Richards, D., Morren, J. A. & Pioro, E. P. Time to diagnosis and factors affecting diagnostic delay in amyotrophic lateral sclerosis. J. Neurol. Sci. 417, 117054 (2020).
Mamarabadi, M., Razjouyan, H. & Golbe, L. I. Is the latency from progressive supranuclear palsy onset to diagnosis improving? Mov. Disord. Clin. Pract. 5, 603–606 (2018).
Tsoukra, P. et al. The diagnostic challenge of young-onset dementia syndromes and primary psychiatric diseases: results from a retrospective 20-year cross-sectional study. J. Neuropsychiatry Clin. Neurosci. 34, 44–52 (2022).
Cousins, K. A. Q. et al. Distinguishing frontotemporal lobar degeneration tau from TDP-43 using plasma biomarkers. JAMA Neurol. 79, 1155–1164 (2022).
Suarez-Calvet, M. et al. Plasma phosphorylated TDP-43 levels are elevated in patients with frontotemporal dementia carrying a C9orf72 repeat expansion or a GRN mutation. J. Neurol. Neurosurg. Psychiatry 85, 684–691 (2014).
Ren, Y. et al. TDP-43 and phosphorylated TDP-43 levels in paired plasma and CSF samples in amyotrophic lateral sclerosis. Front. Neurol. 12, 663637 (2021).
Katisko, K. et al. Serum total TDP-43 levels are decreased in frontotemporal dementia patients with C9orf72 repeat expansion or concomitant motoneuron disease phenotype. Alzheimers Res. Ther. 14, 151 (2022).
Scialo, C. et al. TDP-43 real-time quaking induced conversion reaction optimization and detection of seeding activity in CSF of amyotrophic lateral sclerosis and frontotemporal dementia patients. Brain Commun. 2, fcaa142 (2020).
Beyer, L. et al. TDP-43 as structure-based biomarker in amyotrophic lateral sclerosis. Ann. Clin. Transl. Neurol. 8, 271–277 (2021).
Hu, W. T. et al. Reduced CSF p-Tau181 to Tau ratio is a biomarker for FTLD-TDP. Neurology 81, 1945–1952 (2013).
Irwin, K.E. et al. A fluid biomarker reveals loss of TDP-43 splicing repression in presymptomatic ALS-FTD. Nat. Med. 30, 382–393 (2024).
Luk, C. et al. Development and assessment of sensitive immuno-PCR assays for the quantification of cerebrospinal fluid three- and four-repeat tau isoforms in tauopathies. J. Neurochem. 123, 396–405 (2012).
Meredith, J. E. Jr et al. Characterization of novel CSF Tau and ptau biomarkers for Alzheimer’s disease. PLoS ONE 8, e76523 (2013).
Horie, K. et al. CSF tau microtubule-binding region identifies pathological changes in primary tauopathies. Nat. Med. 28, 2547–2554 (2022).
van Niel, G., D’Angelo, G. & Raposo, G. Shedding light on the cell biology of extracellular vesicles. Nat. Rev. Mol. Cell Biol. 19, 213–228 (2018).
Perez, M., Avila, J. & Hernandez, F. Propagation of tau via extracellular vesicles. Front. Neurosci. 13, 698 (2019).
Leroux, E. et al. Extracellular vesicles: major actors of heterogeneity in tau spreading among human tauopathies. Mol. Ther. 30, 782–797 (2022).
Wang, Y. et al. The release and trans-synaptic transmission of Tau via exosomes. Mol. Neurodegener. 12, 5 (2017).
Asai, H. et al. Depletion of microglia and inhibition of exosome synthesis halt tau propagation. Nat. Neurosci. 18, 1584–1593 (2015).
Iguchi, Y. et al. Exosome secretion is a key pathway for clearance of pathological TDP-43. Brain 139, 3187–3201 (2016).
Stuendl, A. et al. Alpha-synuclein in plasma-derived extracellular vesicles is a potential biomarker of Parkinson’s disease. Mov. Disord. 36, 2508–2518 (2021).
Lionnet, A. et al. Characterisation of tau in the human and rodent enteric nervous system under physiological conditions and in tauopathy. Acta Neuropathol. Commun. 6, 65 (2018).
Mukaetova-Ladinska, E. B. et al. Platelet Tau protein as a potential peripheral biomarker in Alzheimer’s disease: an explorative study. Curr. Alzheimer Res. 15, 800–808 (2018).
Kvetnoy, I. M. et al. Tau-protein expression in human blood lymphocytes: a promising marker and suitable sample for life-time diagnosis of Alzheimer’s disease. Neuro. Endocrinol. Lett. 21, 313–318 (2000).
Norman, M. et al. L1CAM is not associated with extracellular vesicles in human cerebrospinal fluid or plasma. Nat. Methods 18, 631–634 (2021).
Boyarko, B. & Hook, V. Human tau isoforms and proteolysis for production of toxic tau fragments in neurodegeneration. Front. Neurosci. 15, 702788 (2021).
Neumann, M. et al. Ubiquitinated TDP-43 in frontotemporal lobar degeneration and amyotrophic lateral sclerosis. Science 314, 130–133 (2006).
Folstein, M. F., Folstein, S. E. & McHugh, P. R. ‘Mini-Mental State’. A practical method for grading the cognitive state of patients for the clinician. J. Psychiatr. Res. 12, 189–198 (1975).
Nasreddine, Z. S. et al. The Montreal Cognitive Assessment, MoCA: a brief screening tool for mild cognitive impairment. J. Am. Geriatr. Soc. 53, 695–699 (2005).
Golbe, L. I. & Ohman-Strickland, P. A. A clinical rating scale for progressive supranuclear palsy. Brain 130, 1552–1565 (2007).
Piot, I. et al. The Progressive Supranuclear Palsy Clinical Deficits Scale. Mov. Disord. 35, 650–661 (2020).
Schwab R. S. & England, A. Projection technique for evaluating surgery in Parkinson’s disease. in Third Symposium on Parkinson’s Disease (eds Billingham, F. H. & Donaldson, M. C.) 152–157 (Churchill, 1969).
Guy, W. in ECDEU Assessment Manual for Psychopharmacology—Revised. DHEW Publ No ADM 76-338. (U.S. Dept. of Health, Education, and Welfare, Public Health Service, Alcohol, Drug Abuse, and Mental Health Administration, National Institute of Mental Health, Psychopharmacology Research Branch, Division of Extramural Research Programs, 1976).
Goetz, C. G. et al. Movement Disorder Society-sponsored revision of the Unified Parkinson’s Disease Rating Scale (MDS-UPDRS): process, format, and clinimetric testing plan. Mov. Disord. 22, 41–47 (2007).
Starkstein, S. E. et al. Reliability, validity, and clinical correlates of apathy in Parkinson’s disease. J. Neuropsychiatry Clin. Neurosci. 4, 134–139 (1992).
Schrag, A. et al. Measuring quality of life in PSP: the PSP-QoL. Neurology 67, 39–44 (2006).
Pfeffer, R. I., Kurosaki, T. T., Harrah, C. H. Jr., Chance, J. M. & Filos, S. Measurement of functional activities in older adults in the community. J. Gerontol. 37, 323–329 (1982).
Hughes, C. P., Berg, L., Danziger, W. L., Coben, L. A. & Martin, R. L. A new clinical scale for the staging of dementia. Br. J. Psychiatry 140, 566–572 (1982).
Knopman, D. S., Weintraub, S. & Pankratz, V. S. Language and behavior domains enhance the value of the Clinical Dementia Rating Scale. Alzheimers Dement. 7, 293–299 (2011).
Cummings, J. L. et al. The Neuropsychiatric Inventory: comprehensive assessment of psychopathology in dementia. Neurology 44, 2308–2314 (1994).
Wear, H. J. et al. The Cambridge Behavioural Inventory revised. Dement. Neuropsychol. 2, 102–107 (2008).
Neumann, M. et al. TDP-43 in the ubiquitin pathology of frontotemporal dementia with VCP gene mutations. J. Neuropathol. Exp. Neurol. 66, 152–157 (2007).
Gijselinck, I. et al. Loss of TBK1 is a frequent cause of frontotemporal dementia in a Belgian cohort. Neurology 85, 2116–2125 (2015).
Alcolea, D. et al. The Sant Pau Initiative on Neurodegeneration (SPIN) cohort: a data set for biomarker discovery and validation in neurodegenerative disorders. Alzheimers Dement. (N Y) 5, 597–609 (2019).
Vaquer-Alicea, J., Diamond, M. I. & Joachimiak, L. A. Tau strains shape disease. Acta Neuropathol. 142, 57–71 (2021).
Ritz, D. et al. Endolysosomal sorting of ubiquitylated caveolin-1 is regulated by VCP and UBXD1 and impaired by VCP disease mutations. Nat. Cell Biol. 13, 1116–1123 (2011).
Zhang, Y. et al. Cerebellar Kv3.3 potassium channels activate TANK-binding kinase 1 to regulate trafficking of the cell survival protein Hax-1. Nat. Commun. 12, 1731 (2021).
Schwickart, M., Vainshtein, I., Lee, R., Schneider, A. & Liang, M. Interference in immunoassays to support therapeutic antibody development in preclinical and clinical studies. Bioanalysis 6, 1939–1951 (2014).
O’Brien, K., Ughetto, S., Mahjoum, S., Nair, A. V. & Breakefield, X. O. Uptake, functionality, and re-release of extracellular vesicle-encapsulated cargo. Cell Rep. 39, 110651 (2022).
Ramos-Zaldivar, H. M. et al. Extracellular vesicles through the blood–brain barrier: a review. Fluids Barriers CNS 19, 60 (2022).
Riva, N. et al. Phosphorylated TDP-43 aggregates in peripheral motor nerves of patients with amyotrophic lateral sclerosis. Brain 145, 276–284 (2022).
Wood, J. D. Enteric nervous system: neuropathic gastrointestinal motility. Dig. Dis. Sci. 61, 1803–1816 (2016).
James, B. D. et al. TDP-43 stage, mixed pathologies, and clinical Alzheimer’s-type dementia. Brain 139, 2983–2993 (2016).
Nelson, P. T. et al. Frequency of LATE neuropathologic change across the spectrum of Alzheimer’s disease neuropathology: combined data from 13 community-based or population-based autopsy cohorts. Acta Neuropathol. 144, 27–44 (2022).
Nelson, P. T. et al. Limbic-predominant age-related TDP-43 encephalopathy (LATE): consensus working group report. Brain 142, 1503–1527 (2019).
Rohrer, J. D. et al. Serum neurofilament light chain protein is a measure of disease intensity in frontotemporal dementia. Neurology 87, 1329–1336 (2016).
Gendron, T. F. et al. Comprehensive cross-sectional and longitudinal analyses of plasma neurofilament light across FTD spectrum disorders. Cell Rep. Med. 3, 100607 (2022).
Katisko, K. et al. GFAP as a biomarker in frontotemporal dementia and primary psychiatric disorders: diagnostic and prognostic performance. J. Neurol. Neurosurg. Psychiatry 92, 1305–1312 (2021).
Zhu, N. et al. Plasma glial fibrillary acidic protein and neurofilament light chain for the diagnostic and prognostic evaluation of frontotemporal dementia. Transl. Neurodegener. 10, 50 (2021).
Jack, C. R. Jr et al. NIA-AA research framework: toward a biological definition of Alzheimer’s disease. Alzheimers Dement. 14, 535–562 (2018).
Ludolph, A. et al. A revision of the El Escorial criteria - 2015. Amyotroph. Lateral Scler. Frontotemporal Degener. 16, 291–292 (2015).
Cedarbaum, J. M. et al. The ALSFRS-R: a revised ALS functional rating scale that incorporates assessments of respiratory function. BDNF ALS Study Group (Phase III). J. Neurol. Sci. 169, 13–21 (1999).
Abrahams, S., Newton, J., Niven, E., Foley, J. & Bak, T. H. Screening for cognition and behaviour changes in ALS. Amyotroph. Lateral Scler. Frontotemporal Degener. 15, 9–14 (2014).
Strong, M. J. et al. Amyotrophic lateral sclerosis–frontotemporal spectrum disorder (ALS–FTSD): revised diagnostic criteria. Amyotroph. Lateral Scler. Frontotemporal Degener. 18, 153–174 (2017).
Rascovsky, K. et al. Sensitivity of revised diagnostic criteria for the behavioural variant of frontotemporal dementia. Brain 134, 2456–2477 (2011).
Lemos, R., Duro, D., Simoes, M. R. & Santana, I. The free and cued selective reminding test distinguishes frontotemporal dementia from Alzheimer’s disease. Arch. Clin. Neuropsychol. 29, 670–679 (2014).
Welsh, K. A. et al. The Consortium to Establish a Registry for Alzheimer’s Disease (CERAD). Part V. A normative study of the neuropsychological battery. Neurology 44, 609–614 (1994).
Bertoux, M. et al. Social cognition and emotional assessment differentiates frontotemporal dementia from depression. J. Neurol. Neurosurg. Psychiatry 83, 411–416 (2012).
Scogin, F., Rohen, N. & Bailey, E. in Handbook of Psychological Assessment in Primary Care Settings (ed. Maruish M. E.) 491–508 (Erlbaum, 2000).
Gorno-Tempini, M. L. et al. Classification of primary progressive aphasia and its variants. Neurology 76, 1006–1014 (2011).
Bozeat, S., Lambon Ralph, M. A., Patterson, K., Garrard, P. & Hodges, J. R. Non-verbal semantic impairment in semantic dementia. Neuropsychologia 38, 1207–1215 (2000).
Billette, O. V., Sajjadi, S. A., Patterson, K. & Nestor, P. J. SECT and MAST: new tests to assess grammatical abilities in primary progressive aphasia. Aphasiology 29, 1135–1151 (2015).
Huber, W., Poeck, K., Weniger, D. & Willmes, K. Der Aachener Aphasie Test (AAT) (Hogrefe, 1983).
Ziegler, W., Aichert, I., Staiger, A. & Schimeczek, M. HWL-kompakt. https://neurophonetik.de/sprechapraxie-wortlisten (2019).
Hodges, J. R., Martinos, M., Woollams, A. M., Patterson, K. & Adlam, A. L. Repeat and point: differentiating semantic dementia from progressive non-fluent aphasia. Cortex 44, 1265–1270 (2008).
Respondek, G. & Hoglinger, G. U. DescribePSP and ProPSP: German multicenter networks for standardized prospective collection of clinical data, imaging data, and biomaterials of patients with progressive supranuclear palsy. Front. Neurol. 12, 644064 (2021).
Litvan, I. et al. Clinical research criteria for the diagnosis of progressive supranuclear palsy (Steele–Richardson–Olszewski syndrome): report of the NINDS-SPSP international workshop. Neurology 47, 1–9 (1996).
Hoglinger, G. U. et al. Clinical diagnosis of progressive supranuclear palsy: The movement disorder society criteria. Mov. Disord. 32, 853–864 (2017).
Neumann, M. et al. Phosphorylation of S409/410 of TDP-43 is a consistent feature in all sporadic and familial forms of TDP-43 proteinopathies. Acta Neuropathol. 117, 137–149 (2009).
Montine, T. J. et al. National Institute on Aging–Alzheimer’s Association guidelines for the neuropathologic assessment of Alzheimer’s disease: a practical approach. Acta Neuropathol. 123, 1–11 (2012).
Attems, J. et al. Neuropathological consensus criteria for the evaluation of Lewy pathology in post-mortem brains: a multi-centre study. Acta Neuropathol. 141, 159–172 (2021).
Mackenzie, I. R. et al. A harmonized classification system for FTLD-TDP pathology. Acta Neuropathol. 122, 111–113 (2011).
Brooks, B. R., Miller, R. G., Swash, M., Munsat, T. L. & World Federation of Neurology Research Group on Motor Neuron Diseases El Escorial revisited: revised criteria for the diagnosis of amyotrophic lateral sclerosis. Amyotroph. Lateral Scler. Other Motor Neuron Disord. 1, 293–299 (2000).
Campos, T. S. et al. Spanish adaptation of the revised Amyotrophic Lateral Sclerosis Functional Rating Scale (ALSFRS-R). Amyotroph. Lateral Scler. 11, 475–477 (2010).
Eren, E. et al. Neuronal-derived EV biomarkers track cognitive decline in Alzheimer’s disease cells. Cells 11, 436 (2022).
Oender, D. et al. Evolution of clinical outcome measures and biomarkers in sporadic adult-onset degenerative ataxia. Mov. Disord. 38, 654–664 (2023).
Hanley, J. A. & McNeil, B. J. A method of comparing the areas under receiver operating characteristic curves derived from the same cases. Radiology 148, 839–843 (1983).
Boyd, K. et al. (eds) in ECML PKDD 2013, Part III, LNAI 8190, 451–466 (Springer, 2013).
Barer, Y. et al. Epidemiology of progressive supranuclear Palsy: Real world data from the second largest health plan in Israel.Brain. Sci. 12, 1126 (2022).
Brown, C. A., Lally, C., Kupelian, V. & Flanders, W. D. Estimated Prevalence and Incidence of Amyotrophic Lateral Sclerosis and SOD1 and C9orf72 genetic variants. Neuroepidemiology 55, 342–353 (2021).
Onyike, C. U. & Diehl-Schmid, J. The epidemiology of frontotemporal dementia. Int Rev. Psychiatry 25, 130–137 (2013).
Acknowledgements
We thank the patients and their caregivers who participated in the study. This study was funded by a grant from the German Federal Ministry of Education and Research (BMBF), grant identifier 01KX2230, to A. Schneider. A. Schneider received funding from BMBF (DESCARTES consortium, grant identifier 01EK2102A, and PREPARE, grant identifier 01GP2213A), Verum Foundation and BMBF/NUM (UTN consortium). E.M. and A. Schneider received funding from Cure Alzheimer’s Fund. C.D. and A. Schneider. received funding from Netzwerke NRW iBehave consortium. E.M. received funding from the Katharina Hardt Foundation. A. Schneider is member of the Deutsche Forschungsgemeinschaft (DFG)-funded Cluster of Excellence ImmunoSensation2—EXC2151—390873048. A. Schneider and A.R. were supported by La Fundación Reina Sofía, proyecto ‘MANOLO BARRÓS’. A. Schneider and A.H. received funding from the Target ALS Foundation. M.C. received funding from Deutsche Demenzhilfe German Center for Neurodegenerative Diseases (DZNE) Innovative Minds Program and the Manfred-Strohscheer Foundation. L.K. received funding from the Hertie Foundation, Hertie Network of Excellence in Clinical Neurosciences and from the EU Joint Programme—Neurodegenerative Disease Research (JPND), grant no. 01ED2007B (PreAdapt). M.W. and M. Schmid received funding from BMBF (DESCARTES consortium, grant identifier 01EK2102A). C. Miklitz received funding from the Neuro-aCSis clinician scientist program (DFG, project no. 493623632). N.H. has received funding support from the DFG (project no. 5302297989). F.H. was funded by the Else Kröner-Fresenius Foundation and the CurePSP Foundation. M. Synofzik was supported by the JPND GENFI-PROX grant (DLR/DFG 01ED2008B). D.M. and M. Synofzik were supported by the Clinician Scientist program ‘PRECISE.net’ funded by the Else Kröner-Fresenius-Stiftung. D.M. and M.Z. were supported by the Clinician Scientist Program of the Medical Faculty Tübingen (D.M., 459-0-0; M.Z., 481-0-0). D.M. was also supported by the Elite Program for Postdoctoral Researchers of the Baden Württemberg Foundation (1.16101.21). K. Brockmann has received research funding from the Michael J. Fox Foundation for Parkinson’s Research (MJFF-022343, MJFF-023275, MJFF-023365), the German Society for Parkinson (DPG), the Health Forum Baden Wuerttemberg, the Else Kröner-Fresenius Stiftung (ClinbrAIn), the University of Tuebingen, and from the DFG (BR-655671-1). J.W. received funding from the BMBF (grant identifier 13GW0479B). R.P. is supported by the DFG (1007) under Germany’s Excellence Strategy within the framework of 1008 the Munich Cluster for Systems Neurology (EXC 2145 SyNergy—ID 390857198), the Davos Alzheimer’s Collaborative, the VERUM Foundation, the Robert Vogel Memorial Foundation, the National Institutes for Health and Care Research (NIHR) Sheffield Biomedical Research Centre (NIHR203321), the University of Cambridge–Ludwig-Maximilians-University Munich Strategic Partnership within the framework of the German Excellence Initiative and Excellence Strategy and the European Commission under the Innovative Health Initiative program (project no. 101132356) R.R.-G. has been funded by Instituto de Salud Carlos III (ISCIII) through project no. PI23/00845, co-funded by European Regional Development Fund/European Social Fund (ERDF/ESF), ‘A way to make Europe’/‘Investing in your future’. M.A.S.-S. is supported by funding from the ISCIII (Juan Rodés research grant no. JR18-00018; Fondo de investigación sanitaria grant no. PI19/00882), the Alzheimer’s Association clinician scientist fellowship (AACSF-22-972945), and the National Institutes of Health (R01AG080470). D.A. received research grants from ISCIII, Spain PI18/00435, PI22/00611, INT19/00016, INT23/00048, and from the Department of Health Generalitat de Catalunya PERIS program SLT006/17/12. I.I.-G. is a senior Atlantic Fellow for Equity in Brain Health at the Global Brain Health Institute (GBHI), and receives funding from the GBHI, the Alzheimer’s Association and the Alzheimer’s Society (GBHI ALZ UK-21-720973 and AACSF-21-850193). I.I.-G. was also supported by the Juan Rodés Contract (JR20/0018) and PI21/00791 from ISCIII. O.D.-I. is funded by The Association for Frontotemporal Degeneration (Clinical Research Postdoctoral Fellowship, AFTD 2019–2021). This work was supported by research grants from FUNDELA (‘Por un mundo sin ELA’) and ISCIII, Spain PI18/00326 and PI21/01395 to O.D.-I. S.R.-G. received funding from Alzheimer’s Association (grant no. AACSF-21-850193). G.H. was funded by the DFG under Germany’s Excellence Strategy within the framework of the Munich Cluster for Systems Neurology (EXC 2145 SyNergy—ID 390857198), DFG (HO2402/18-1 MSAomics). A. Hermann is supported by the Hermann und Lilly Schilling Stiftung für medizinische Forschung im Stifterverband.
Funding
Open access funding provided by Deutsches Zentrum für Neurodegenerative Erkrankungen e.V. (DZNE) in der Helmholtz-Gemeinschaft.
Author information
Authors and Affiliations
Contributions
A. Schneider initiated this work and supervised the study. A.S., M.C. and S.Ö. drafted the paper. O.P., N.C.C., X.W., L.-S.S., J. Priller, E.S., A.K., P.K., T.K., I.R.V., A. Spottke, D.C.H., K.F., C. Miklitz, C. McCormick, P.W., B.F., M. Bähr, J.W., N.H., M. Brandt, I.Z., A.G., A.F., E. Dinter, W.G., K. Bürger, D.J., R.P., B.S.R., F.H., O.W., J.L., S.T., I.K., J. Prudlo, T.G., K. Brockmann, D.M., M.Z., M. Synofzik, C.W., O.K., R.G., E. Dübel, E.I., D.G., I.I.-G., R.R.-G., A.L., A.C., J.F., S.R.-G., D.A., M.A.S.-S., J.T.-S., J.S.-G., O.D.-I., G.H., A. Hermann and A. Schneider collected the blood samples and patient data. M.W., I.F., S.R. and L.B. collected the neuropsychological data. M. Schmid contributed to CSF biomarker cut-off data. M.T.H. and F.B. analyzed CSF biomarker data. C.F., S.Ö., M. Chatterjee, C.D., M. Schmid and L.K. analyzed the biomarker and clinical data. M.N., A. Halle, J.H. and R.B. performed neuropathological diagnosis and provided data. A.R., P.R. and P.H. collected and analyzed the genetic data in DESCRIBE. O.D.-I. collected and analyzed the genetic data in the Sant Pau cohort. C.F., S.Ö. and M. Chatterjee conducted and analyzed the laboratory, cell culture and biochemistry work. W.M. performed electron microscopy analysis. E.M. and J.B. contributed recombinant tau protein. N.R.B. and R.J.B. performed immunoprecipitation–mass spectrometry on CSF and blood EV tau. S.Ö. and M. Chatterjee are equal contributors listed as first coauthors. A. Schneider is the senior and corresponding author.
Corresponding author
Ethics declarations
Competing interests
All authors had access to the data in the study and accepted responsibility for submitting the paper for publication. A. Schneider serves in a scientific advisory board for and receives honoraria from Biogen. She additionally received funding for a scientific collaboration from Eisai and honoraria for presentations from Eisai. M.C. is currently an employee of uniQure Biopharma B.V. and recipient of employee stock options. F.H. receives author fees from Thieme medical publishers and W. Kohlhammer GmbH medical publishers. P.H. is an employee and owns stock in Alector LLC. K. Brockmann is a consultant for F. Hoffmann-La Roche Ltd, Vanqua Bio and the Michael J. Fox Foundation for Parkinson’s Research and has received speaker honoraria from AbbVie, Lundbeck, UCB (Union Chimique Belge) and Zambon. N.H. has received travel support from Eli Lilly. A. Hermann has received honoraria for presentations and participation in advisory boards from Amylyx and IFT Pharma. He has received royalities from Elsevier Press and Kohlhammer. Washington University and R.J.B. have equity ownership interest in C2N Diagnostics and R.J.B. receives income from C2N Diagnostics for serving on the scientific advisory board. R.J.B. and N.R.B. may receive income based on technology (methods to detect microtubule binding region (MTBR) tau isoforms and use thereof) licensed by Washington University to C2N Diagnostics. R.J.B. has received research funding from Avid Radiopharmaceuticals, Janssen, Roche/Genentech, Eli Lilly, Eisai, Biogen, AbbVie, Bristol Myers Squibb and Novartis. R.J.B. serves on the Roche Gantenerumab Steering Committee as an unpaid member. R.G. received speaker fees and nonfinancial support from Biogen, Roche, Zambon and research support from Biogen, ITF Pharma and Zambon outside this work. D.A. participated in advisory boards from Fujirebio-Europe, Roche Diagnostics, Grifols S.A. and Lilly, and received speaker honoraria from Fujirebio-Europe, Roche Diagnostics, Nutricia, Krka Farmacéutica S.L., Zambon S.A.U. and Esteve Pharmaceuticals S.A. D.A. declares a filed patent application (WO2019175379 A1 Markers of synaptopathy in neurodegenerative disease). J.W. received lecture honoraria from Beeijing Yibai Science and Technology Ltd, Gloryren, Janssen Cilag, Pfizer, Med Update GmbH, Roche Pharma, Lilly and serves on advisory boards for Biogen, Abbott, Boehringer Ingelheim, Lilly, MSD Sharp & Dohme and Roche. M. Brandt received speaker honoraria from Idorsia, Eisai and Bristol Myers Squibb. All other authors state no competing interests.
Peer review
Peer review information
Nature Medicine thanks the anonymous reviewers for their contribution to the peer review of this work. Primary Handling Editor: Jerome Staal, in collaboration with the Nature Medicine team.
Additional information
Publisher’s note Springer Nature remains neutral with regard to jurisdictional claims in published maps and institutional affiliations.
Extended data
Extended Data Fig. 1 Study Design.
Pilot study with samples from the DESCRIBE cohort (subcohort 1): HC, AD, svPPA, bvFTD, PSP groups, based on clinical diagnosis and supported by CSF biomarkers in AD; detection of plasma EV 3R/4R Tau. Validation study in the larger DESCRIBE subcohort 2, comprising samples of the DESCRIBE cohort with HC, ALS, bvFTD and PSP groups and 63 pathology confirmed samples: detection of plasma EV 3R/4R Tau ratios, plasma EV TDP-43 levels, and plasma TDP-43 concentrations. Validation of plasma EV Tau ratios, and plasma EV TDP-43 levels in the independent Sant Pau cohort, including HC, ALS, ALS-FTD, bvFTD, and PSP as diagnostic groups with altogether 34 genetically confirmed samples. Lower panel: Experimental flow of sEV and mEV preparation. This figure was created using BioRender.com.
Extended Data Fig. 2 Correlation of plasma EV Tau ratio with NfL in DESCRIBE cohort 2 and Sant Pau cohort.
(a-d) Two-sided Spearman correlation analysis of associations and monotonic regression splines between plasma sEV 3R/4R Tau ratios and plasma Nfl levels in (a) PSP (p = 0.000012) and (b) bvFTD (p = 0.000051) diagnostic groups. Spearman correlation analysis of associations and monotonic regression splines between plasma sEV TDP-43 levels and plasma Nfl levels in (c) ALS (p = 0.000046) and (d) bvFTD (p = 0.000063). (e-g) Sant Pau cohort: Spearman correlation analysis of associations and monotonic regression splines between plasma sEV 3R/4R Tau ratio and plasma Nfl levels in (e) PSP and (f) bvFTD. Spearman correlation analysis of associations and monotonic regression splines between plasma sEV TDP-43 and plasma Nfl levels in (g) bvFTD (p = 0.000085). (NfL measurements were only available for a subset of Sant Pau cases).
Extended Data Fig. 3 Plasma TDP-43 levels in DESCRIBE subcohort 2.
(biologically independent samples: HC n = 56, ALS n = 165, bvFTD n = 179, PSP n = 163). The long horizontal line represents the median and the short horizontal lines represent the inter-quartile range (IQR) Kruskal–Wallis test with Dunn’s correction for multiple comparisons. ns: non-significant.
Extended Data Fig. 4 Plasma sEV 3R/4R Tau ratio versus plasma EV TDP-43 levels in bvFTD cases of DESCRIBE subcohort 2.
Genetically or neuropathologically defined bvFTD cases are indicated by the different color-codes. Cut-off values as determined by Gaussian mixture modeling for subcohort 2 (Fig. 4, Supplementary Fig. 15). The two cut-offs for separation of bvFTD into putative TDP-43 and Tau pathology groups are indicated by bold blue lines (sEV 3R/4R Tau ratio cut-off: 1.27; sEV TDP-43 cut-off: 13.87 pg/ml).
Extended Data Fig. 5 Sant Pau cohort, Receiver Operating Characteristic (ROC) curves for plasma sEV 3R/4R Tau ratios.
(a) PSP vs. HC (b) PSP vs. ALS (c) PSP vs. ALS-FTD (d) PSP vs. bvFTD (e) bvFTD vs. HC (f) bvFTD vs. ALS (g) bvFTD vs. ALS-FTD.
Extended Data Fig. 6 Receiver Operating Characteristic (ROC) curve with AUC values for plasma sEV TDP-43 in Sant Pau cohort.
(a) ALS vs. HC (b) ALS vs. ALS-FTD (c) ALS vs. PSP (d) ALS vs. bvFTD (e) ALS-FTD vs. HC (f) ALS-FTD vs. PSP (g) ALS-FTD vs. bvFTD (h) bvFTD vs. HC (i) bvFTD vs. PSP.
Extended Data Fig. 7 Receiver Operating Characteristic (ROC) curve with AUC values for plasma sEV TDP-43 (red) and plasma NfL (blue) in the Sant Pau cohort.
(a) bvFTD vs. HC and (b) bvFTD vs. PSP. Plasma NfL levels were not available for ALS and ALS-FTD groups.
Supplementary information
Supplementary Information
Supplementary Figs. 1–23.
Supplementary Tables
Supplementary Tables 1–22.
Supplementary Data for Extended Data Tables 1–3.
Exact P values for comparisons of Extended Data Tables 1–3.
Rights and permissions
Open Access This article is licensed under a Creative Commons Attribution 4.0 International License, which permits use, sharing, adaptation, distribution and reproduction in any medium or format, as long as you give appropriate credit to the original author(s) and the source, provide a link to the Creative Commons licence, and indicate if changes were made. The images or other third party material in this article are included in the article’s Creative Commons licence, unless indicated otherwise in a credit line to the material. If material is not included in the article’s Creative Commons licence and your intended use is not permitted by statutory regulation or exceeds the permitted use, you will need to obtain permission directly from the copyright holder. To view a copy of this licence, visit http://creativecommons.org/licenses/by/4.0/.
About this article

Cite this article
Chatterjee, M., Özdemir, S., Fritz, C. et al. Plasma extracellular vesicle tau and TDP-43 as diagnostic biomarkers in FTD and ALS. Nat Med 30, 1771–1783 (2024). https://doi.org/10.1038/s41591-024-02937-4
Received:
Accepted:
Published:
Issue Date:
DOI: https://doi.org/10.1038/s41591-024-02937-4
